Org Chart
The Org Chart is a visual map of who reports to whom across your workforce. Every active user appears as a card -- showing their name, position title, and department -- connected to the manager (or managers) they report to. It's built from the same manager assignments and department data you configure on Users and Departments; the chart itself is a viewer and light editor for that reporting structure, not a separate data set.
Navigation
Sidebar → Workforce → Org Chart (/org-chart)
Opening the route requires the User: View permission. That permission's scope also gates what the chart shows -- the route only allows the three scopes below; any other scope on User: View blocks the page entirely:
| Scope value | What the chart shows |
|---|---|
| All | Every active user in the company, in one chart. |
| Department | Only users in the signed-in user's own department. |
| Direct Reports | The signed-in user's own card, plus their direct reports' -- their reporting chain downward. |
A manager with Direct Reports scope, for example, sees a much smaller chart than an admin with All -- their own card and everyone under them, not the whole company. See Permission Matrix Deep Dive for how these scope values work generally.
What the Org Chart Is For
The Org Chart lets you see and edit reporting lines across the company from one canvas, instead of opening each person's profile one at a time. Dragging a connection between two cards, double-clicking a card, or clicking an edge all change the same underlying manager assignment that appears as Reports To on a user's profile and that powers Direct Reports-scoped permissions everywhere else in Appello.
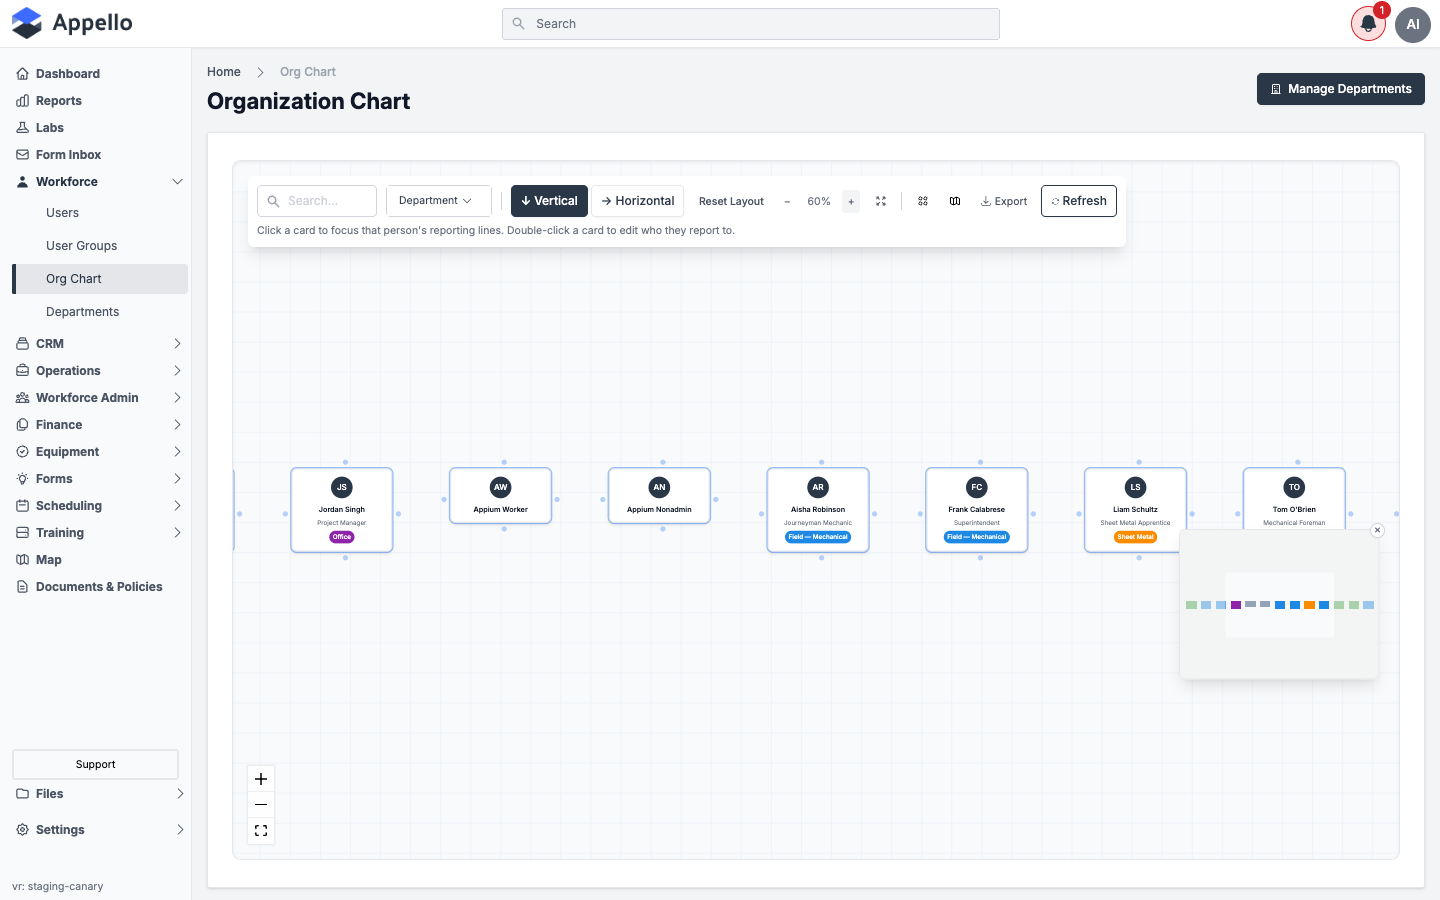
This is what the chart looks like when no manager relationships have been assigned yet -- every user renders as an unconnected root card, laid out side by side with no lines between them. As soon as one assign a manager action runs, the affected cards connect and the auto-layout redraws the tree.
Reading the Chart: Nodes and Edges
Nodes -- what's on a card
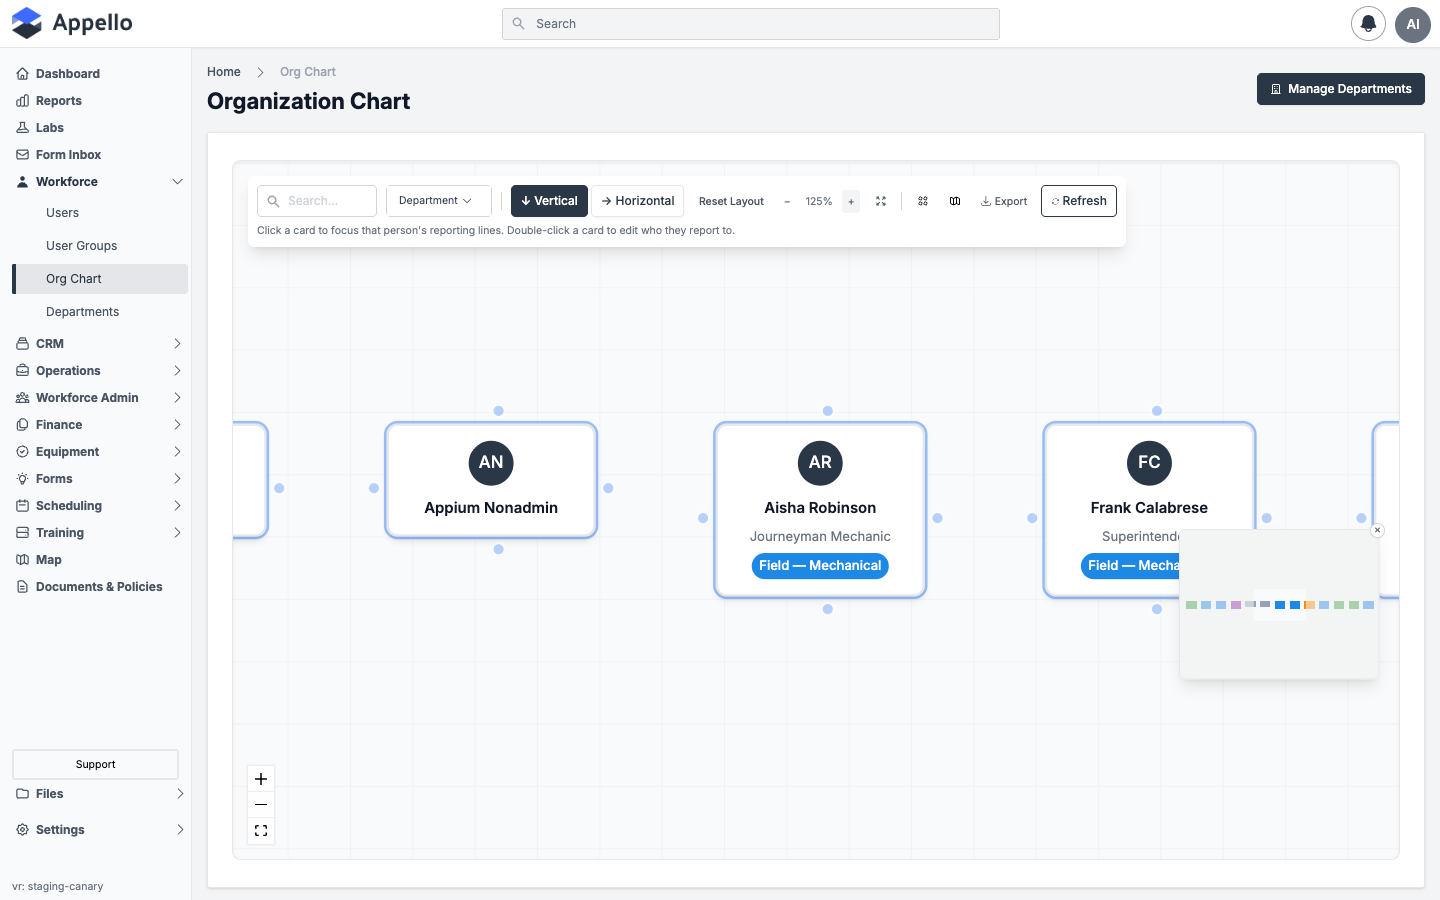
Each card represents one active, non-deleted, non-archived user (superusers and system users never appear). A card shows:
| Element | Source |
|---|---|
| Avatar | The user's profile photo, or their initials if none is set. |
| Full name | The user's name. |
| Position | The user's Position field, if set. |
| Department badge | The user's department name, colored with that department's configured color (plain gray if the department has no color or the user has none). |
| Direct-report count | Shown only when greater than zero -- how many people this card is the primary manager for, in this tree. |
| Highlighted border | Cards with no manager at all (true root users) get a colored border and ring so they stand out as the top of a branch. |
Edges -- where the lines come from
A line runs from a manager's card to each of their reports, one line per manager relationship. Appello's data model allows a user to have more than one manager -- if that happens, the card draws an incoming line from every manager, but the automatic tree layout can only nest a card under one parent at a time. It picks the first manager (in a stable, deterministic order) that doesn't close a reporting loop as that card's position in the tree; every other manager relationship still renders as a line, just not as the tree parent.
If two users are each listed as the other's manager (a reporting loop), the chart breaks the loop rather than hiding both cards -- one of them still renders as a root so the rest of the chart isn't affected. Both manager relationships still exist and still draw as edges.
Manager relationships are the same ones shown -- read-only -- as Reports To under Employment Information on a user's own profile:
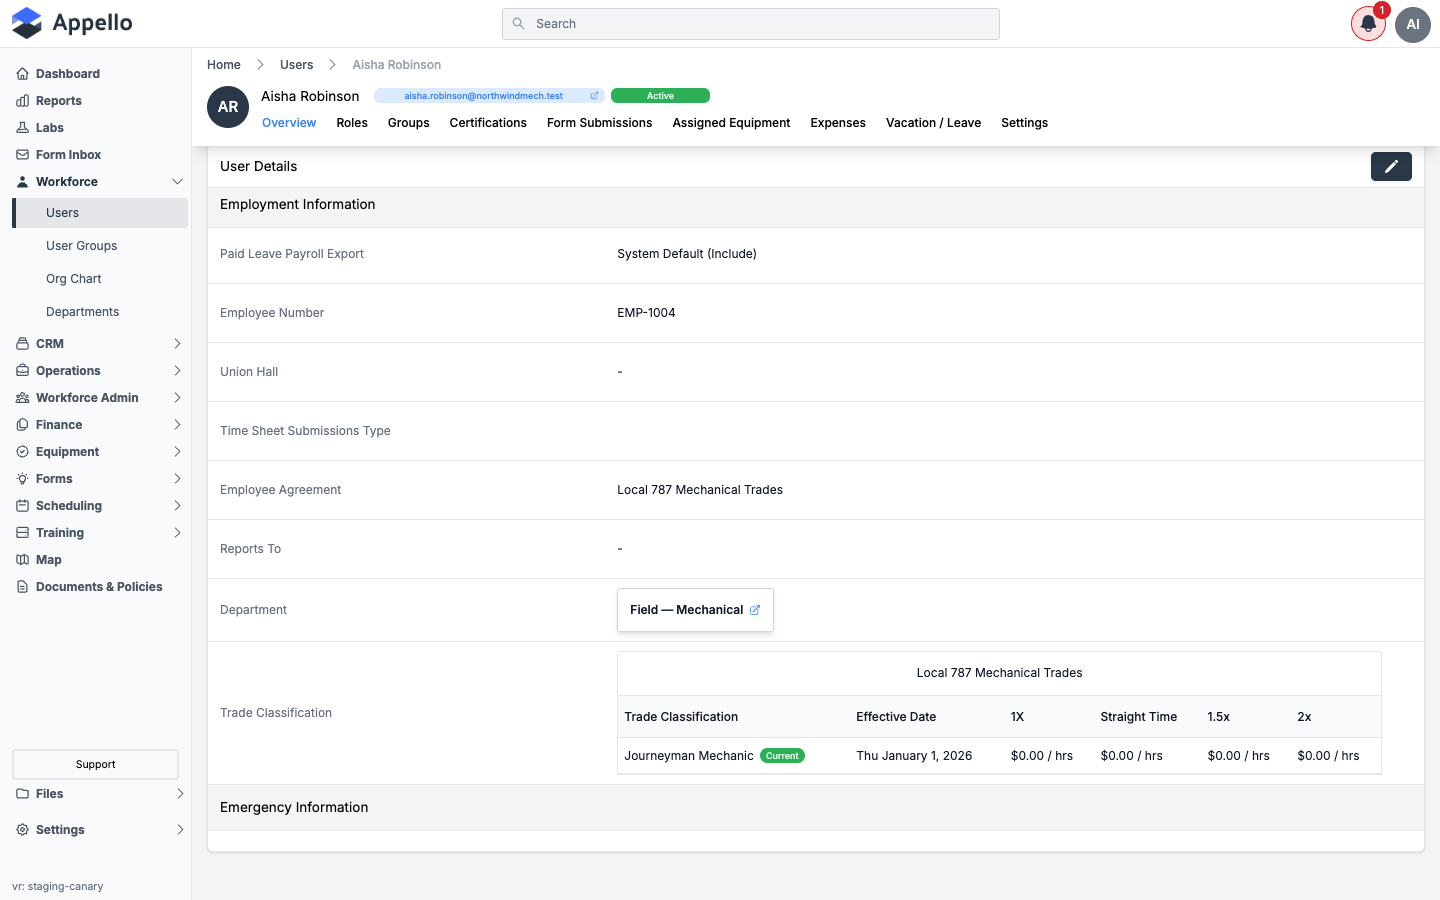
See User Profile Page → Overview. Reports To can also be set directly on the Create User and Edit User forms (see Users) -- the Org Chart is not the only place to assign a manager, just the only place you can see the whole structure and drag connections between people.
Toolbar and Layout Controls
| Control | What it does |
|---|---|
| Search | Filters cards by name or position text match; matching cards stay full-opacity, everything else dims. |
| Department | Multi-select filter; dims every card outside the checked department(s). Combines with Search (a card must match both). |
| Vertical / Horizontal | Switches the auto-layout tree orientation (top-down vs. left-to-right). Defaults to Vertical. |
| Reset Layout | Re-runs the automatic tree layout in the current orientation and saves the recalculated positions for everyone. |
| − / + (toolbar) and the canvas-corner Zoom In / Zoom Out / Fit View | Two ways to zoom -- the toolbar shows the current zoom percentage; the canvas-corner controls are React Flow's built-in zoom/fit buttons. |
| Grid toggle | Shows or hides the dotted background grid. |
| Minimap toggle | Shows or hides the small overview panel in the bottom-right corner. |
| Export | Renders the current canvas view to a PNG or JPEG file, downloaded to your browser -- this is a client-side image of what's on screen, not a server-generated report. |
| Refresh | Reloads the chart data from the server, keeping your current pan/zoom position. |
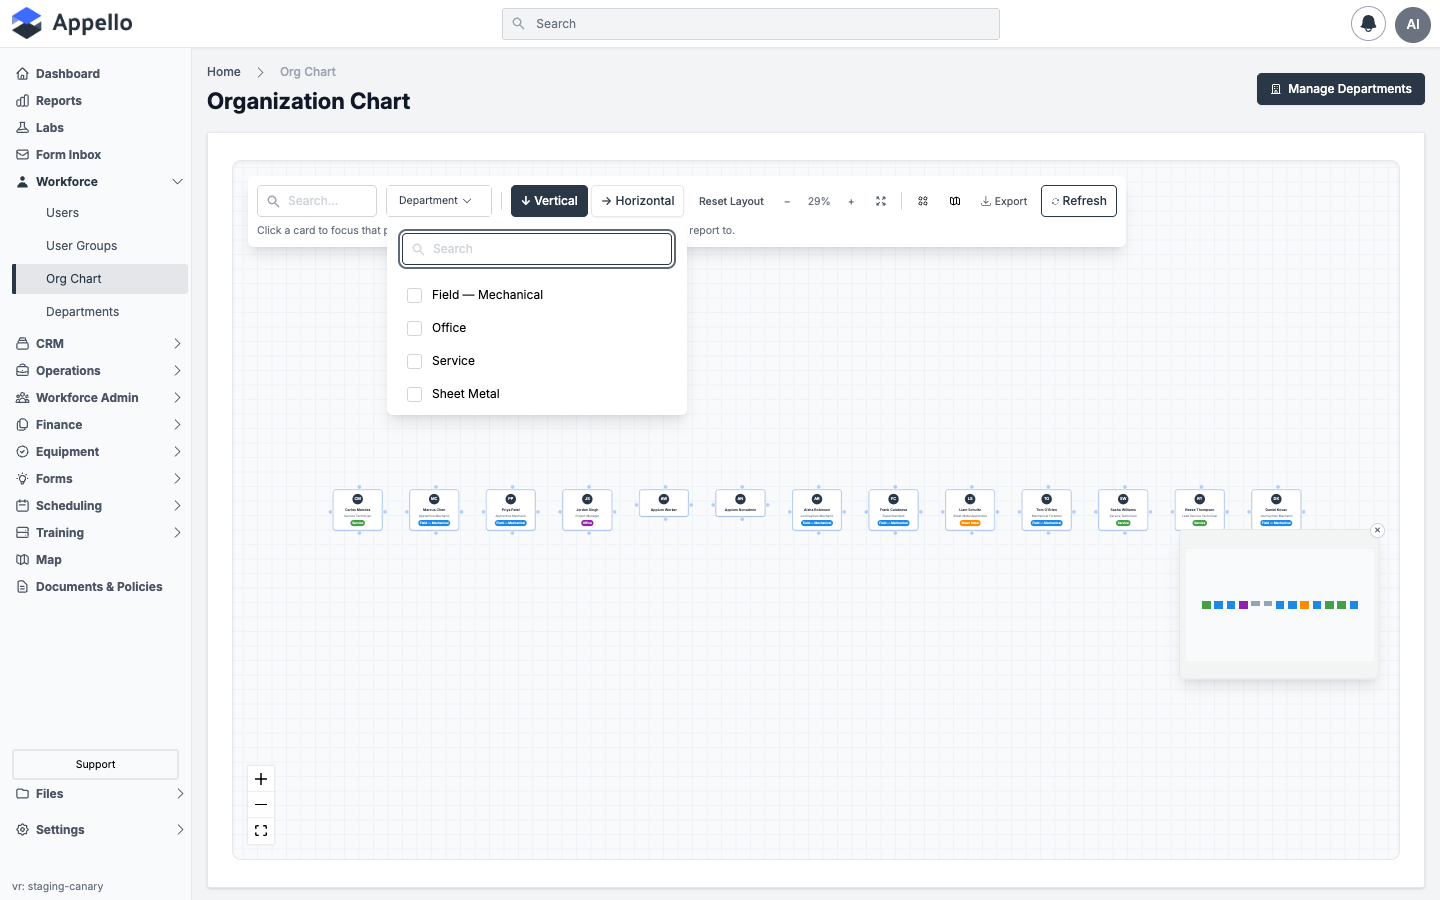
As of 1.33, the desktop Org Chart has no expand/collapse control for hiding a branch's subtree -- every visible card is drawn at once. Fit View and the zoom controls are the only way to manage a large chart's on-screen size; filtering by department or searching by name/position is the way to narrow down which cards you're looking at.
Workflow: Navigating the Chart
- Search or filter to narrow down a large chart -- type a name/position into Search, or check one or more departments in the Department filter. Everything else on the canvas dims rather than disappearing.
- Single-click a card to focus that person's full reporting chain -- every manager above them (all the way to the top) and every report below them (all the way down) highlights in a distinct color, with a small panel showing the ancestor and descendant counts and a button to clear the focus. This works for any user, whether or not you can edit the chart.
- Press Escape, or click the × on the focus panel, to clear the focus.
- If you have edit access (see Permissions), double-click a card to open its reporting-relationship panel, or drag from the dot on one card's edge to another card to connect them directly on the canvas -- see below.
Editing Reporting Relationships
Two gestures change who reports to whom, and a third removes a relationship:
| Gesture | What opens |
|---|---|
| Double-click a card | A panel listing that person's current managers, each with Replace and a remove (×) button, plus a search field to Add Manager and a link to open their full profile. |
| Drag a connection from one card's edge handle to another's | A confirmation panel: an arrow shows which way the relationship will run (click the arrow to flip it), and if the person already has a manager, choose Add alongside existing or Replace all managers. |
| Click an edge (the line between two cards) | A confirmation to remove that specific reporting relationship -- the report becomes a root card with no manager if it was their only one. |
Every one of these calls the same two mutations under the hood: adding a manager calls assign_manager_to_user, removing one calls remove_manager_from_user. Appello blocks self-assignment and any assignment that would create a circular reporting chain.
Permissions
| Action | Requires |
|---|---|
| View the chart at all | User: View, scoped to All, Department, or Direct Reports (see above). |
| Drag a card, edit a reporting relationship, or trigger Reset Layout | User: Edit or User: Create (either grants editing -- they're presented as one setting in the permissions interface). |
Without edit access, the canvas is read-only: cards can't be dragged, the connection handles are hidden, and double-clicking or dragging between cards does nothing. Search, filtering, zoom, export, and single-click focus all still work.
Editing Card Positions
Positions are a separate thing from reporting lines -- moving a card around the canvas doesn't change who reports to whom.
- Drag a card to move it anywhere on the canvas (requires edit access, above).
- Appello auto-saves every card you've moved roughly every 5 seconds while you're working -- there's no separate Save button on the canvas itself, and only the cards you actually dragged are sent, not the whole chart.
- Reset Layout discards the manual arrangement and re-runs the automatic tree layout (vertical or horizontal, per the toggle), then saves those recalculated positions the same way.
Positions are saved per user, for everyone -- not per viewer. The next person who opens the Org Chart sees the same custom layout you left it in. A save only ever writes positions for users the saving person has edit access to; if your permissions only cover your own department, moving a card outside it won't persist.
As of 1.33, there is no Clear Positions button in the desktop Org Chart. The underlying
clear_org_chart_positions action resets every editable user's saved position back to
null (so the auto-layout takes over again) and requires an explicit confirmation flag, but
it isn't exposed anywhere in this screen -- the only way to reset the layout from the UI is
Reset Layout, which recalculates and re-saves positions rather than clearing them to
nothing.
The User Hierarchy Behind the Chart
Every edge on the Org Chart, and every Reports To field on a profile, comes from the same manager/direct-report relationship on the user record. Looking up a single user's place in that relationship returns their direct managers and their direct reports -- not the whole chart, just the one person's immediate neighbors.
That same relationship is what Direct Reports-scoped permissions resolve against everywhere else in Appello -- not just on this page. A role with a permission item scoped to Direct Reports sees that user's own records plus records belonging to whoever reports to them on this chart. That's a real, active dependency: changing who reports to whom here changes what a Direct Reports-scoped manager can see and approve elsewhere, including:
- Roles & Permissions and the Permission Matrix Deep Dive -- where Direct Reports is configured as a scope on a permission item.
- Timesheet Matrix → Who Can Approve -- the Approve/Reject Timesheets permission can be scoped to Direct Reports, which resolves through this same reporting structure.
- Leave Submissions → Permissions and Scopes -- the Leave Request permission's View, Edit, Approve, and Archive/Delete items can each be scoped to Direct Reports the same way.
This corrects an earlier version of this page, which stated the org chart's manager relationship only drew the chart and had no effect on permissions or approvals. Based on the 1.33 source, that's not accurate -- Direct Reports scope resolution reads the exact same manager relationship the Org Chart edits, so reassigning a manager here can change who a Direct Reports-scoped role can see and approve.
Related Pages
- Users -- Create and manage the people who appear on the chart; Reports To can also be set from the Create/Edit User form.
- User Profile Page -- The read-only Reports To field on a user's own Overview tab.
- Departments -- The department groupings shown as color tags on each card.
- Roles & Permissions and Permission Matrix Deep Dive -- How All / Department / Direct Reports scoping works generally.
- Timesheet Matrix and Leave Submissions -- Two places where Direct Reports scope is driven by this same reporting structure.