Dashboard
Module: Core | Platform: Web
The Dashboard is the home screen you land on after signing in. It shows your company's key numbers, an account-wide notes feed, and (when enabled) upcoming leave -- each piece controlled by your own permissions and your own metric selections.
Navigation
Sidebar → Dashboard (also the screen you land on immediately after sign-in)
URL: /
Overview
The Dashboard has three columns: Company Metrics on the left, the All Notes feed in the middle, and (for users who can view leave requests) Upcoming Vacation / Leave on the right. If you can't view leave requests, or the metric that enables that widget isn't turned on for you, the notes feed simply takes up the extra width.
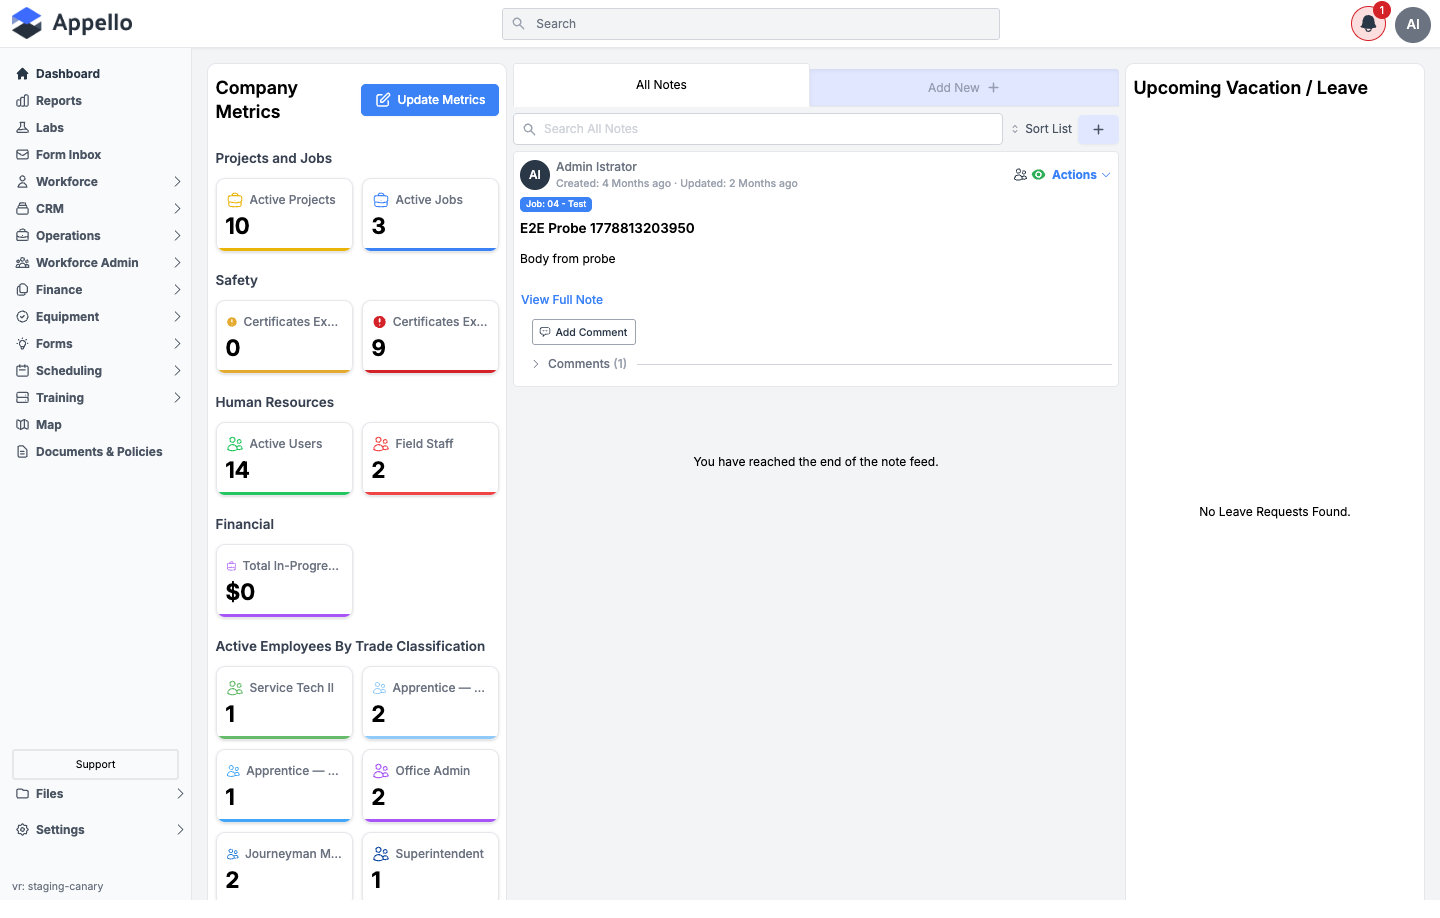
On the demo instance used for this page, the layout also widens the Total value of All Jobs In Progress tile to the full width of the Company Metrics column when its value reaches $10,000,000 or more. Confirmed from source; not something this walkthrough could trigger on the demo instance's data.
Global header controls
These three controls appear in the header on every page, not just the Dashboard:
| Control | What it does |
|---|---|
| Search (search bar, top center) | Opens global search across your instance's records. |
| Notifications bell (top right, with an unread-count badge) | Opens the notification panel. See In-app notifications for the full breakdown. |
| Avatar menu (top right, your initials/photo) | Opens your account menu (profile, instance switching, sign out). |
Global search and the avatar menu have their own pages -- see Global Search and My Profile. This page only covers what's visible from the Dashboard.
Company Metrics
Where it is
Left column of the Dashboard (/).
What it's for
A grid of number tiles -- your company's headline counts and totals -- grouped under headings like Projects and Jobs, Safety, Human Resources, and Financial. Which tiles you see depends on two things: which metrics you've turned on for yourself (see Update Metrics below) and which of those metrics your role has permission to view.
Metric tiles
Each tile shows an icon, a title, a number (or dollar figure), and a colored bar along the bottom. Clicking a tile opens the underlying list, already filtered to match the tile -- for example, Active Jobs opens Jobs filtered to active job statuses.
| Metric | Group | Format | Opens (pre-filtered) | Permission required |
|---|---|---|---|---|
| Active Projects | Projects and Jobs | Number | Projects, filtered to open statuses | Projects → View |
| Active Jobs | Projects and Jobs | Number | Jobs, filtered to active statuses | Jobs → View |
| Certificates Expiring | Safety | Number | Training Record Status report, filtered to expiring-soon | User Certifications → View |
| Certificates Expired | Safety | Number | Training Record Status report, filtered to expired | User Certifications → View |
| Active Users | Human Resources | Number | Users, filtered to active | Users → View |
| Field Staff | Human Resources | Number | Users, filtered to field-staff roles | Users → View |
| Total value of All Jobs In Progress | Financial | Currency | Jobs, filtered to in-progress statuses | Jobs → View and Dashboard Metrics |
| Unbilled WIP | Financial | Currency | Jobs, filtered to in-progress statuses | Jobs → View and Dashboard Metrics |
Dashboard Metrics is its own permission category under Settings → Roles and Permissions ("Financial Metrics on the dashboard"), separate from Jobs → View. A role can view Jobs without being able to see either Financial tile, and vice versa the two permissions are combined for each tile. See Roles & Permissions.
Active Employees By Trade Classification
Below the main grid, a separate Active Employees By Trade Classification section lists one tile per trade classification (Apprentice, Journeyman, Superintendent, etc.), each showing the count of active employees at that level in that level's assigned color. Clicking a tile opens Users filtered to that trade classification.
This section is gated on the Users → View permission, independently of which metrics you've turned on in Update Metrics -- if you can view users, you see it. See Trade Classifications for how the classifications themselves (and their colors) are set up, and that page's own dashboard screenshot for reference.
Empty state
If you haven't turned on any metrics (or none of the metrics you've turned on are ones your role can view), the Company Metrics card shows:
No Metrics Found No metrics are available on this screen
This text is confirmed from source; it was not reproduced on the demo instance, which already has metrics selected.
Update Metrics
Where it is
Dashboard → Company Metrics → Update Metrics button (top-right of the Company Metrics card). The button reads Create Metrics instead if you have never selected any metrics.
What it's for
Opens the Manage Company Metric panel, where you choose which metric tiles appear on your own Dashboard. This is a per-user selection -- it doesn't change what other people see.
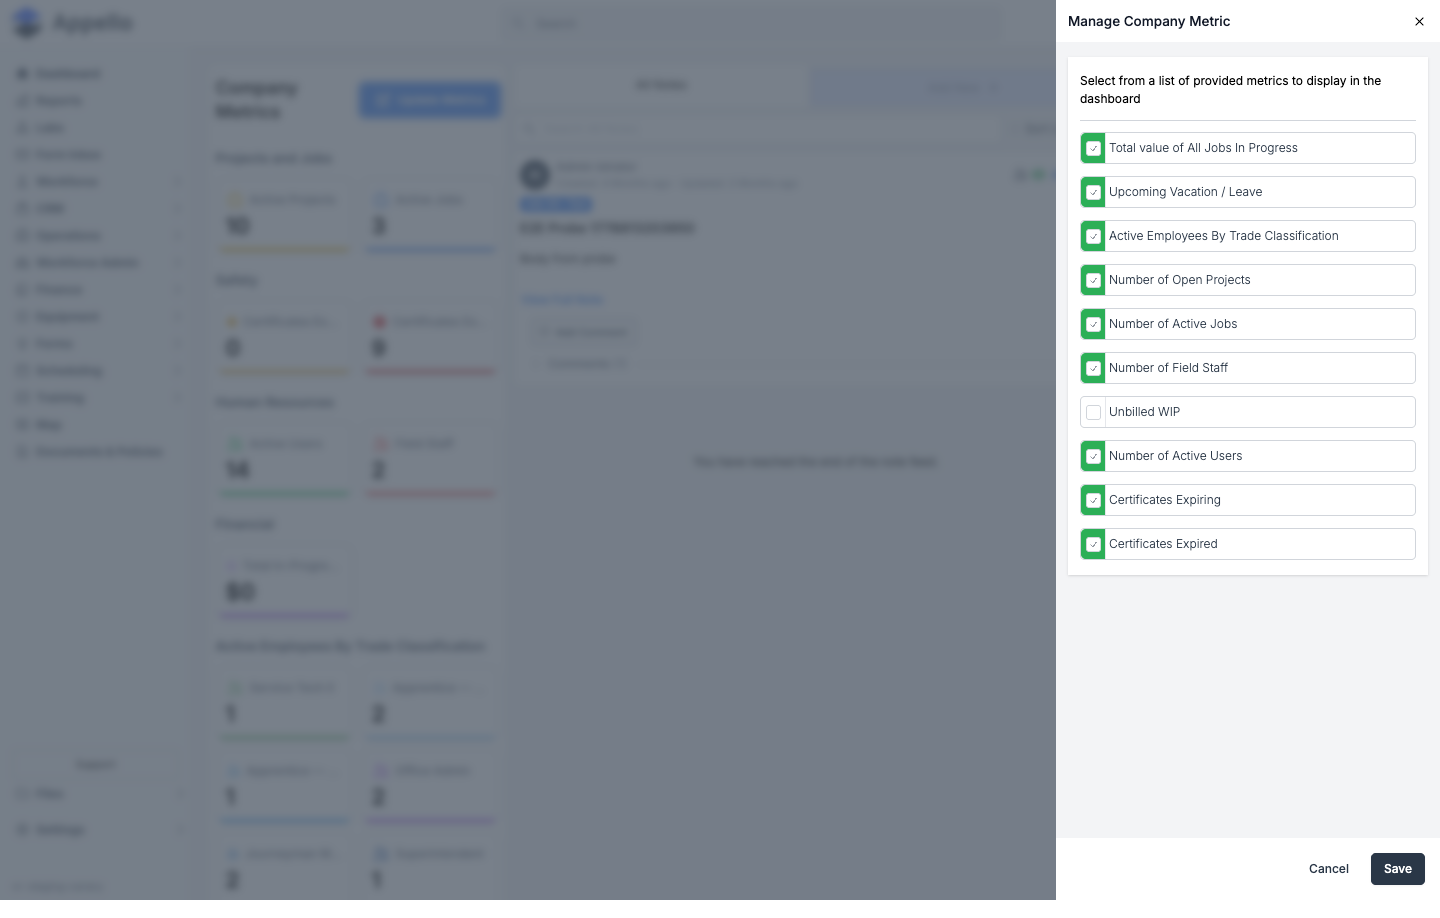
Fields
| Field | Required | Type | Effect |
|---|---|---|---|
| Total value of All Jobs In Progress | No | Checkbox | Shows/hides the Financial tile of the same name |
| Upcoming Vacation / Leave | No | Checkbox | Shows/hides the Upcoming Vacation / Leave column |
| Active Employees By Trade Classification | No | Checkbox | Shows/hides that section (still gated on Users → View) |
| Number of Open Projects | No | Checkbox | Shows/hides the Active Projects tile |
| Number of Active Jobs | No | Checkbox | Shows/hides the Active Jobs tile |
| Number of Field Staff | No | Checkbox | Shows/hides the Field Staff tile |
| Unbilled WIP | No | Checkbox | Shows/hides the Unbilled WIP tile |
| Number of Active Users | No | Checkbox | Shows/hides the Active Users tile |
| Certificates Expiring | No | Checkbox | Shows/hides the Certificates Expiring tile |
| Certificates Expired | No | Checkbox | Shows/hides the Certificates Expired tile |
Every row is a plain checkbox -- there is no drag-to-reorder, grouping, or per-tile color option in this panel; grouping (Projects and Jobs, Safety, etc.) and tile color are fixed by Appello, not user-configurable.
Workflow
- Click Update Metrics (or Create Metrics) above the Company Metrics grid.
- Check the metrics you want to see, uncheck the ones you don't.
- Click Save to apply your changes, or Cancel to close the panel without changing anything.
A checked box only guarantees the tile is a candidate to show -- it still has to pass your role's permission check (see the table above) before it actually appears.
All Notes feed
Where it is
Middle column of the Dashboard.
What it's for
An account-wide notes feed -- every note across every job (and other note-tagged records), newest or most-recently-active first. This is the same feature as a job's own Notes panel, just scoped to your whole account instead of one job, and it's documented in full on its own page.
See Job Notes, Photos & Activity Feed → Notes Feed (Dashboard) for the search box, sort control, custom saved views (tabs), and note actions. This page won't repeat that content.
Upcoming Vacation / Leave
Where it is
Right column of the Dashboard -- only shown if the Upcoming Vacation / Leave metric is turned on for you (see Update Metrics) and you hold the Leave Requests → View permission. If either condition isn't met, the notes feed expands to fill that space instead.
What it's for
Lists Today's Leave Requests and Upcoming Leave Requests, each showing the requesting employee's avatar and name, trade level, leave type, and dates. Clicking a request opens it for viewing or editing (edit access requires Leave Requests → Edit).
Shown empty on the demo instance -- it rendered "No Leave Requests Found" because there was no leave data to display. The widget's title, layout, and the two request lists are confirmed from source and the live page.
Permissions and settings summary
| Permission / setting | What it gates |
|---|---|
| Projects → View | Active Projects tile |
| Jobs → View | Active Jobs tile; combines with Dashboard Metrics for the two Financial tiles |
| User Certifications → View | Certificates Expiring and Certificates Expired tiles |
| Users → View | Active Users and Field Staff tiles; Active Employees By Trade Classification section |
| Dashboard Metrics (Settings → Roles and Permissions) | Total value of All Jobs In Progress and Unbilled WIP tiles, together with Jobs → View |
| Leave Requests → View | Whether the Upcoming Vacation / Leave column appears at all |
| Leave Requests → Edit | Whether clicking a leave request opens it for editing (vs. view-only) |
| Notes → View | Whether the All Notes feed's saved views are visible (per-view, same as the job-level Notes panel) |
| Update Metrics selection (per user) | Which metric tiles are candidates to show for that user -- see Update Metrics |