WIP, Job Completion and Job Activity Reports
Module: Core | Platform: Web
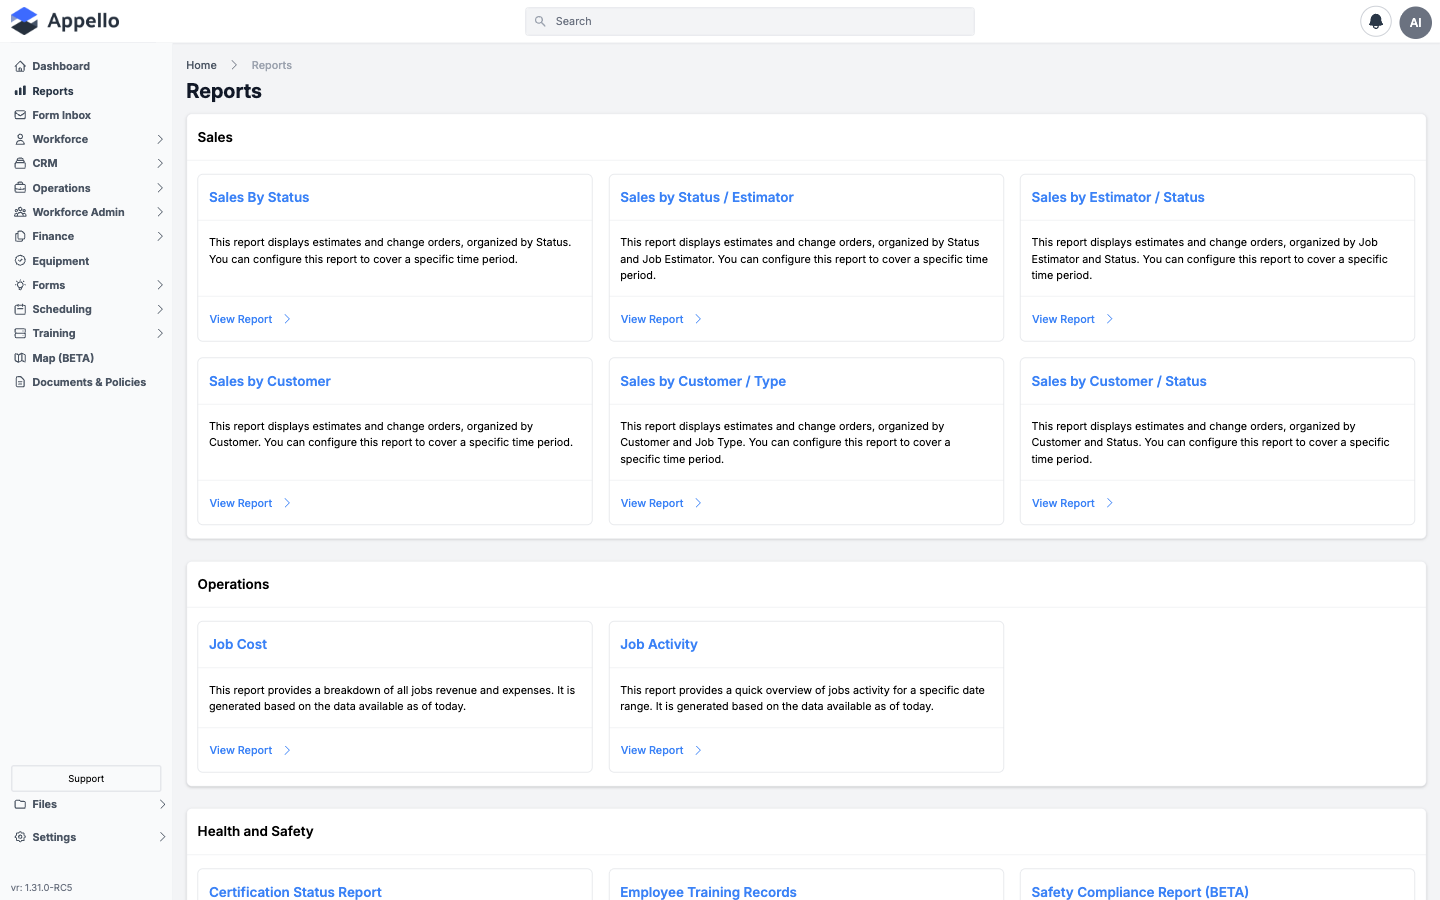
Three of the Operations report cards launched from the Reports hub: the Work-in-Progress (WIP) Report, the Job Cost report (its on-screen title is "Job Costing Report"), and the Job Activity report. All three are read-only, job-level financial and activity views generated live from current data — none of them can be edited from the report screen itself.
Where they are
Sidebar → Reports, then click the tile or list entry under Operations:
| Report | Card label on the hub | URL |
|---|---|---|
| Work-in-Progress (WIP) Report | Work-in-Progress (WIP) Report | /reports/wip-report |
| Job Cost | Job Cost | /reports/job-completion |
| Job Activity | Job Activity | /reports/job-activity |
Work-in-Progress (WIP) Report
What it's for
An underwriter-style "Work on Hand" report — one row per job that has a Won estimate, showing original and revised contract amounts, billed-to-date, cost-to-date, estimated cost to complete, percent complete, and expected/actual gross profit. It supports an as of date so you can reproduce the numbers as they stood on a past date (for bonding, banking, or month-end reporting).
Screenshot
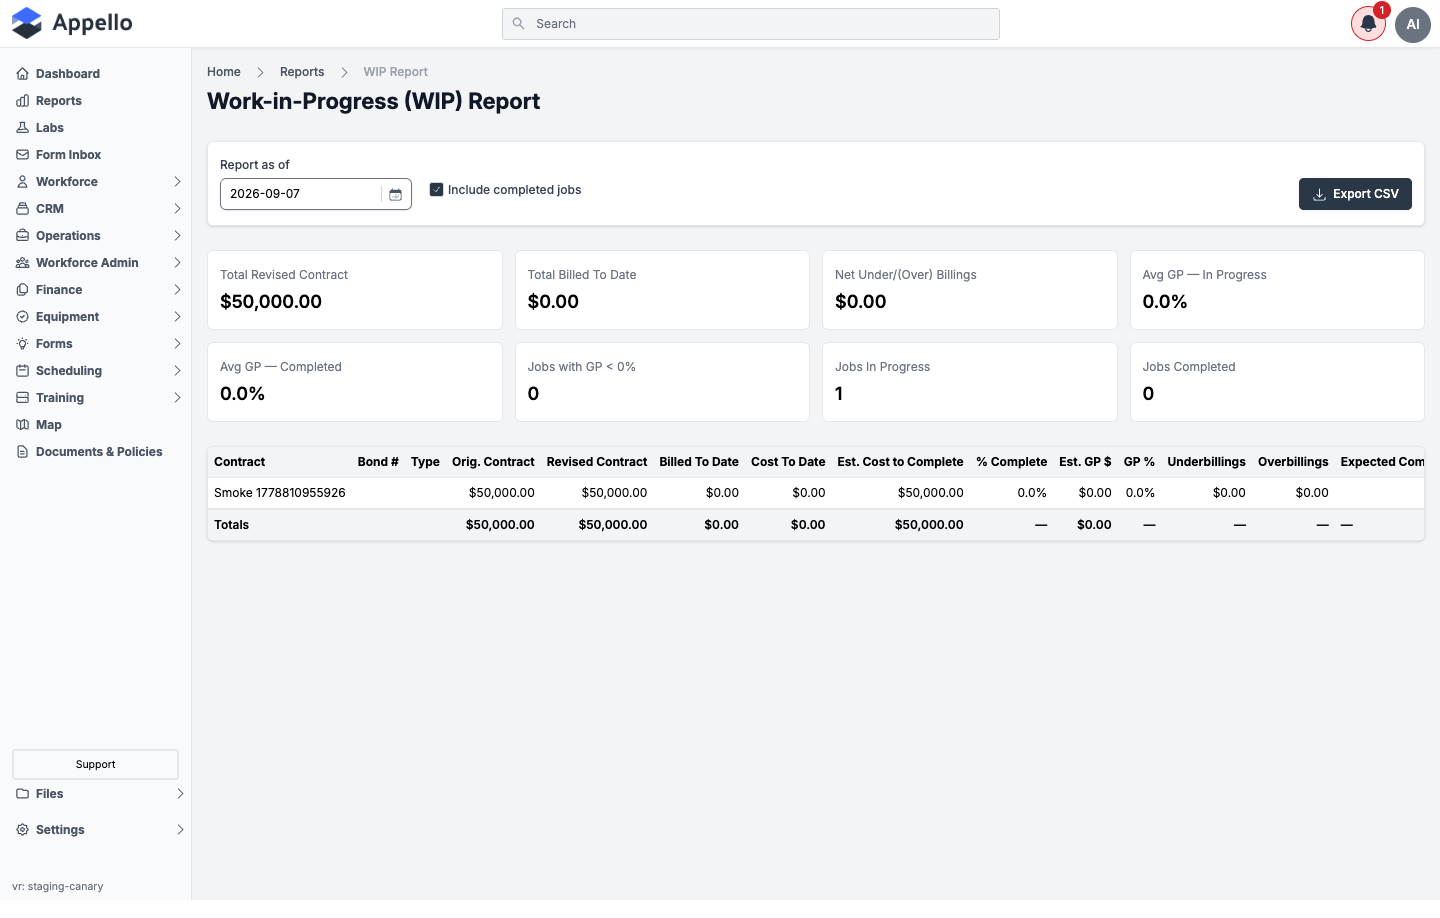
Shown empty on the demo instance — that instance has a single Won job ("Smoke ...") with a $50,000 contract and no recorded billing or cost activity yet, so most columns and summary cards read $0.00 / 0.0%.
Screenshot — filter open
Controls
| Control | Description |
|---|---|
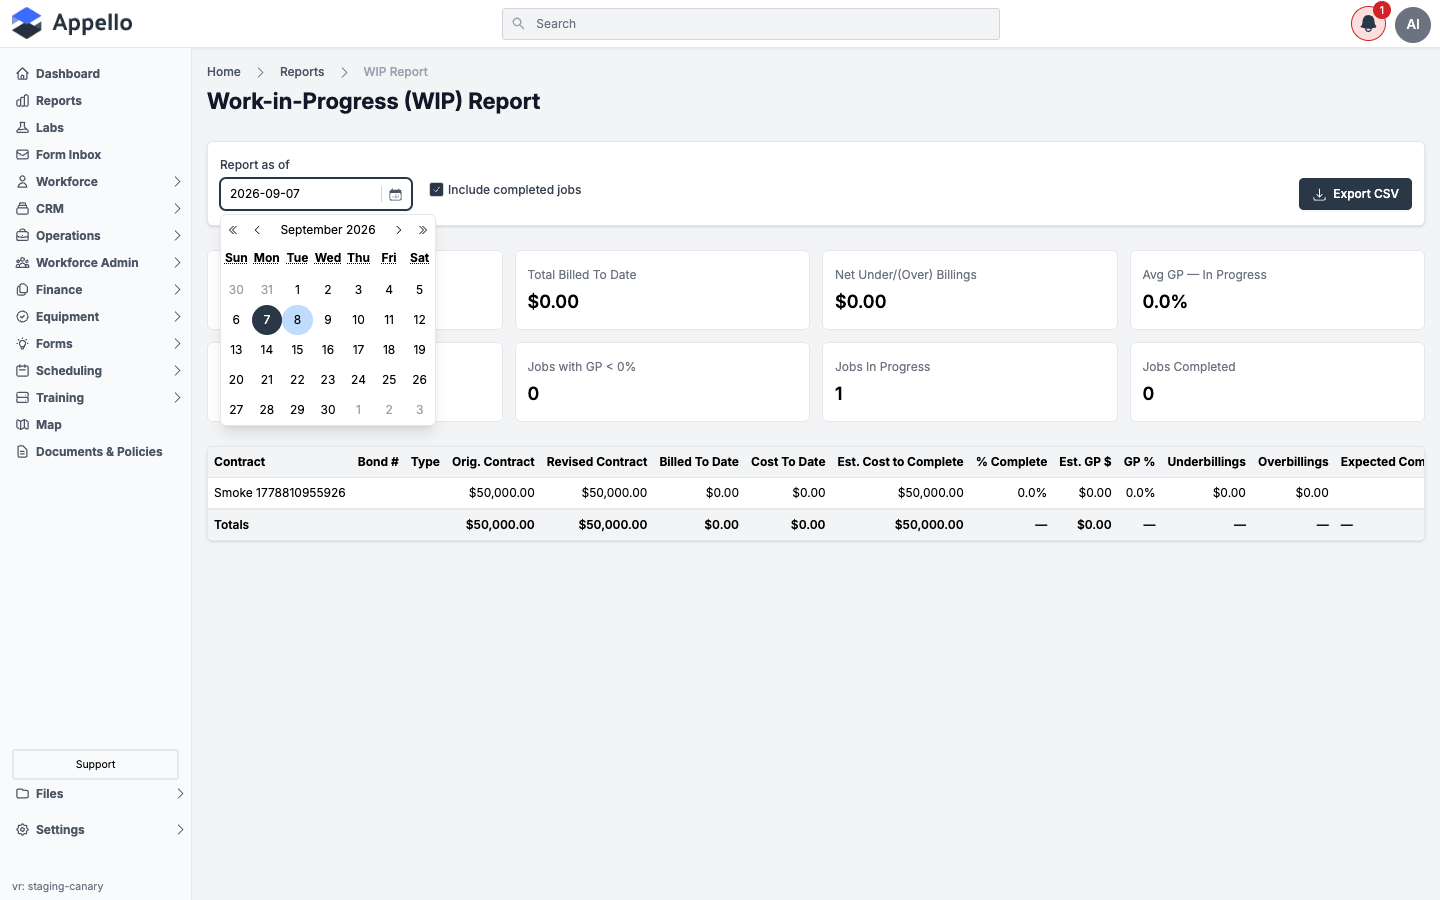
| Report as of | Date field, defaults to today. Recomputes every column and summary card as of 11:59:59 PM on the selected date — only Won estimates/change orders dated (or won) on or before this date, billing through this date, and costs incurred through this date are included. |
| Include completed jobs | Checkbox, checked by default. A job is "completed" once its Estimated Cost to Complete is $0. Unchecking it drops completed jobs from the table and totals. |
| Export CSV | Downloads the current rows as CSV. Disabled while loading or when there are no rows. |
Which jobs appear
A job is eligible for a row if it is not deleted or archived and has at least one EstimateChangeOrderRecord in the instance's "Won" status dated on or before the as of date (using Date Won when set, otherwise the estimate date as a fallback for older records).
Columns
| Column | Calculation |
|---|---|
| Contract | The job's name. |
| Bond # | Custom property configured in Instance Settings as the WIP report's bond-number field (blank if not configured or not set on the job). |
| Type | Custom property configured as the WIP report's contract-type field. |
| Orig. Contract | Sum of the bid amount of Won Estimate-type records (excludes change orders) dated/won on or before the as-of date. |
| Revised Contract | Original Contract plus the bid amount of all Won change orders dated/won on or before the as-of date. |
| Billed To Date | Total billed to the job as of the selected date (from the job's bills/invoices, honoring the instance's tax-in-financials and unrealized-holdback settings). |
| Cost To Date | Total job-level cost incurred up to the as-of date (labour, materials, expenses — the same cost engine used by Job Cost). |
| Est. Cost to Complete | From the most recent Job Financial Forecast on or before the as-of date: forecast cost − Cost To Date. If no forecast exists, falls back to Original Estimated Total Cost − Cost To Date. Never shown below $0. |
| % Complete | Cost To Date ÷ (Cost To Date + Est. Cost to Complete). |
| Est. GP $ | Revised Contract − Cost To Date − Est. Cost to Complete. |
| GP % | Total gross profit (expected, if in progress, or actual, if completed) divided by Revised Contract. Shown in red when negative. |
| Underbillings | max(0, Cost To Date + Earned Profit To Date − Billed To Date). |
| Overbillings | max(0, Billed To Date − Cost To Date − Earned Profit To Date). |
| Expected Completion | The job's forecasted end date, falling back to its planned end date, then its actual end date. |
A job counts as in progress while Est. Cost to Complete is greater than $0, and completed once it reaches $0 — that split drives both the Jobs In Progress / Jobs Completed summary cards and the Include completed jobs filter.
Summary cards
| Card | Calculation |
|---|---|
| Total Revised Contract | Sum of Revised Contract across all rows. |
| Total Billed To Date | Sum of Billed To Date across all rows. |
| Net Under/(Over) Billings | Sum of Underbillings minus sum of Overbillings across all rows. Positive means the portfolio is net underbilled; negative means net overbilled. |
| Avg GP — In Progress | Total expected gross profit of in-progress jobs ÷ total Revised Contract of in-progress jobs. |
| Avg GP — Completed | Total actual gross profit of completed jobs ÷ total Revised Contract of completed jobs. |
| Jobs with GP < 0% | Count of rows where GP % is negative. |
| Jobs In Progress | Count of rows with Est. Cost to Complete > $0. |
| Jobs Completed | Count of rows with Est. Cost to Complete = $0. |
The table footer also totals Orig. Contract, Revised Contract, Billed To Date, Cost To Date, Est.
Cost to Complete, and Est. GP $ — the remaining columns (% Complete, GP %, Underbillings,
Overbillings, Expected Completion) show — in the totals row because they don't sum meaningfully.
How to run it
- Sidebar → Reports, then click Work-in-Progress (WIP) Report under Operations.
- Set Report as of to the date you want the snapshot for (defaults to today).
- Toggle Include completed jobs on or off.
- Review the summary cards and table — it reloads automatically whenever either control changes.
- Click Export CSV to download the current rows.
Permissions
All three of the following are required to view this report:
- The Reports → Operations permission for Work-in-Progress (WIP) Report
- Finance & Admin → Financial Summary → View
- Operations → Jobs → View
Related pages
- Reports hub
- Job Cost Report — per-job financial drill-down (Financial Overview tab on a job)
- Progress Reports
- Cost Codes & Schedule of Values
Job Cost
What it's for
A portfolio-wide revenue-vs-expense breakdown for every job you have access to, always as of today — there's no historical "as of" date like the WIP Report. Appello's own report description calls it "a breakdown of all jobs revenue and expenses ... generated based on the data available as of today." On screen the report's own title is Job Costing Report; the Reports hub lists the same card as Job Cost.
Screenshot
Because this report requires at least one filter before it will run, the demo instance shows the data below only after filtering to Status: In Progress:
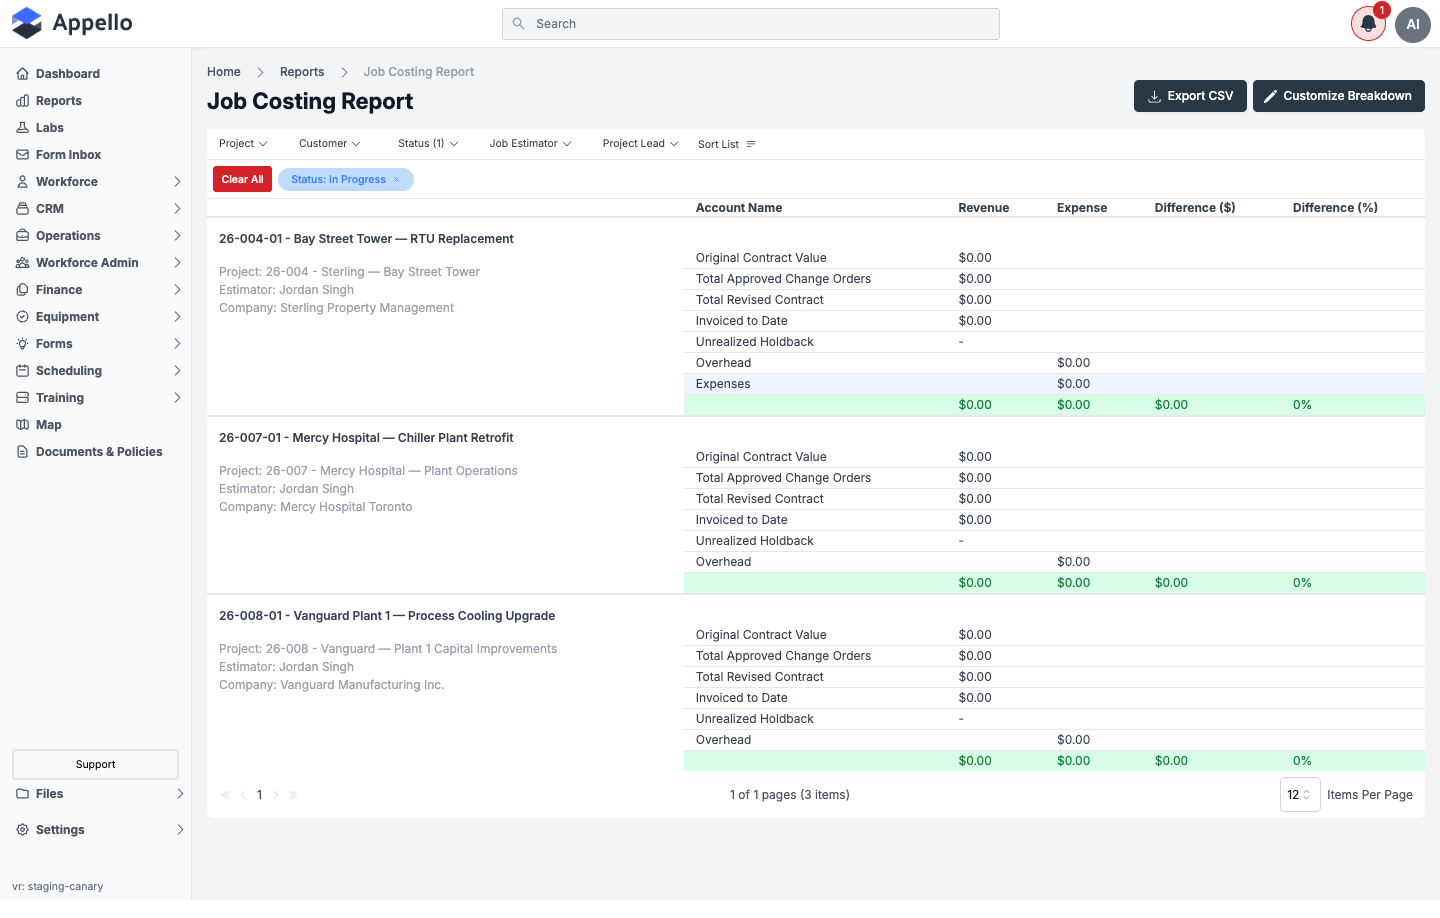
Shown empty (all $0.00) on the demo instance — the three in-progress demo jobs have no invoiced revenue or posted expenses yet, so every account row and the green totals row read $0.00 / 0%.
Screenshot — filter open
The report opens straight into this filter panel and will not load any rows until you pick at least one filter:
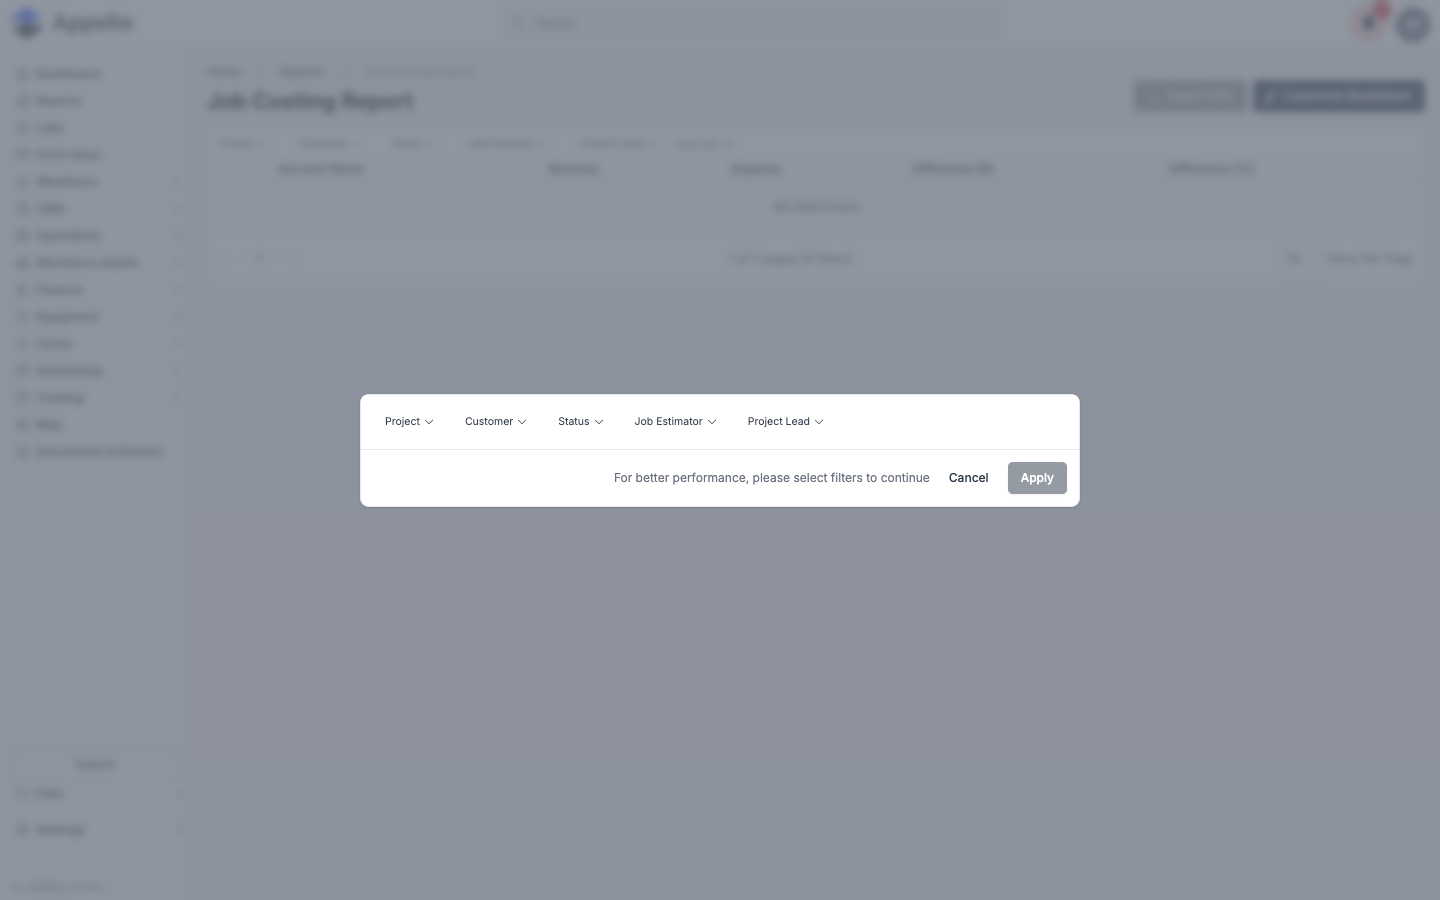
Controls
| Control | Description |
|---|---|
| Project | Multi-select filter. |
| Customer | Multi-select filter. |
| Status | Multi-select filter — job statuses on the demo instance: Draft, In Progress, Quoting, Won. |
| Job Estimator | Multi-select filter, by the job's estimator/lead. |
| Project Lead | Multi-select filter. Locked to your own name and disabled when your Job Cost report permission is scoped to Project Based (see Permissions below). |
| Apply / Cancel | The filter panel shows a live "N results found" count as you pick filters; Apply is disabled until at least one filter is selected. Cancel returns you to the Reports hub. |
| Customize Breakdown | Opens a panel to choose which account categories and individual account items get their own line in the expense breakdown (vs. rolling up into their account type's total). This is a per-instance setting, not per-run. |
| Export CSV | Downloads the currently filtered rows. Disabled while loading or when there are no rows. |
You can reopen the filter panel at any time from the filter bar under the page title (Project ▾ Customer ▾ Status ▾ Job Estimator ▾ Project Lead ▾), which mirrors the same five filters and shows your active selections as removable chips plus a Clear All button.
Columns
Each job renders as its own block, not a single flat row — a job header line, a small info panel, then one line per financial item, and a totals line:
| Column | Calculation |
|---|---|
| (Job header) | Job number and name, linking to the job's Financial Overview — see Job Cost Report. Underneath: Project number/name, Project Lead (if set), Estimator (if set), and Company. |
| Account Name | The line item's label — e.g. Original Contract Value, Total Approved Change Orders, Total Revised Contract, Invoiced to Date, Subsidy / Subsidy Billed To Date (only if the job has a subsidy), Unrealized Holdback, Overhead, then one row per account type / account category / account item included in the Customize Breakdown selection. |
| Revenue | Populated on the revenue lines: Original Contract Value, Total Approved Change Orders, Total Revised Contract, Invoiced to Date (invoiced-to-date minus any subsidy already billed), Subsidy, Subsidy Billed To Date, and Unrealized Holdback (shown as - when the job has none). |
| Expense | Populated on the expense lines: Overhead, then each account type / category / item's expense total — journal-entry amount + wages + approved expenses (+ tax, if the instance includes tax in financials); Board/Travel/Parking timesheet costs are folded into the Labour account type and its Travel category. |
| Difference ($) (totals row only) | Total Revenue − Total Expense for the job, shown in parentheses and highlighted red when negative, otherwise highlighted green. |
| Difference (%) (totals row only) | |Difference ($)| ÷ Total Revenue, as a percentage, with the same red/green highlighting. |
Total Revenue for the job = Invoiced to Date + Subsidy Billed To Date + Unrealized Holdback (only if your instance includes unrealized holdback in job cost and the job has any). Total Expense = sum of all account-type expense totals + Overhead + Board/Travel/Parking.
Drill-down links
- Clicking a job header opens that job's Financial Overview tab in a new tab — the detailed, single-job version of this same revenue/expense data. See Job Cost Report.
How to run it
- Sidebar → Reports, then click Job Cost under Operations.
- The filter panel opens automatically. Pick at least one of Project, Customer, Status, Job Estimator, or Project Lead — the panel shows a live result count as you select.
- Click Apply.
- Review each job's revenue/expense breakdown and its totals row.
- Use the filter bar's chips or Clear All to change the filter, or click a filter dropdown there to adjust it without reopening the modal.
- Click Customize Breakdown to change which account categories/items show their own line.
- Click Export CSV to download the filtered rows.
Permissions
- The Reports → Operations permission for Job Cost. This one is scoped: when your scope is Project Based, you only see jobs where you're the Project Lead, and the Project Lead filter is locked to your own name.
Related pages
- Reports hub
- Job Cost Report — the per-job version of this same breakdown, reached by clicking a job header here
- Progress Reports
- Cost Codes & Schedule of Values
Job Activity
What it's for
A quick, date-ranged overview of which jobs had activity — approved labour hours, approved employee/accounts-payable expenses, or timesheet-based board/travel/parking charges — in a given window. Like Job Cost, Appello's own description notes it's "generated based on the data available as of today" (today drives which timesheets/expenses count as "Approved" at the moment you run it), but the report itself is windowed by the date-range filter below.
Screenshot
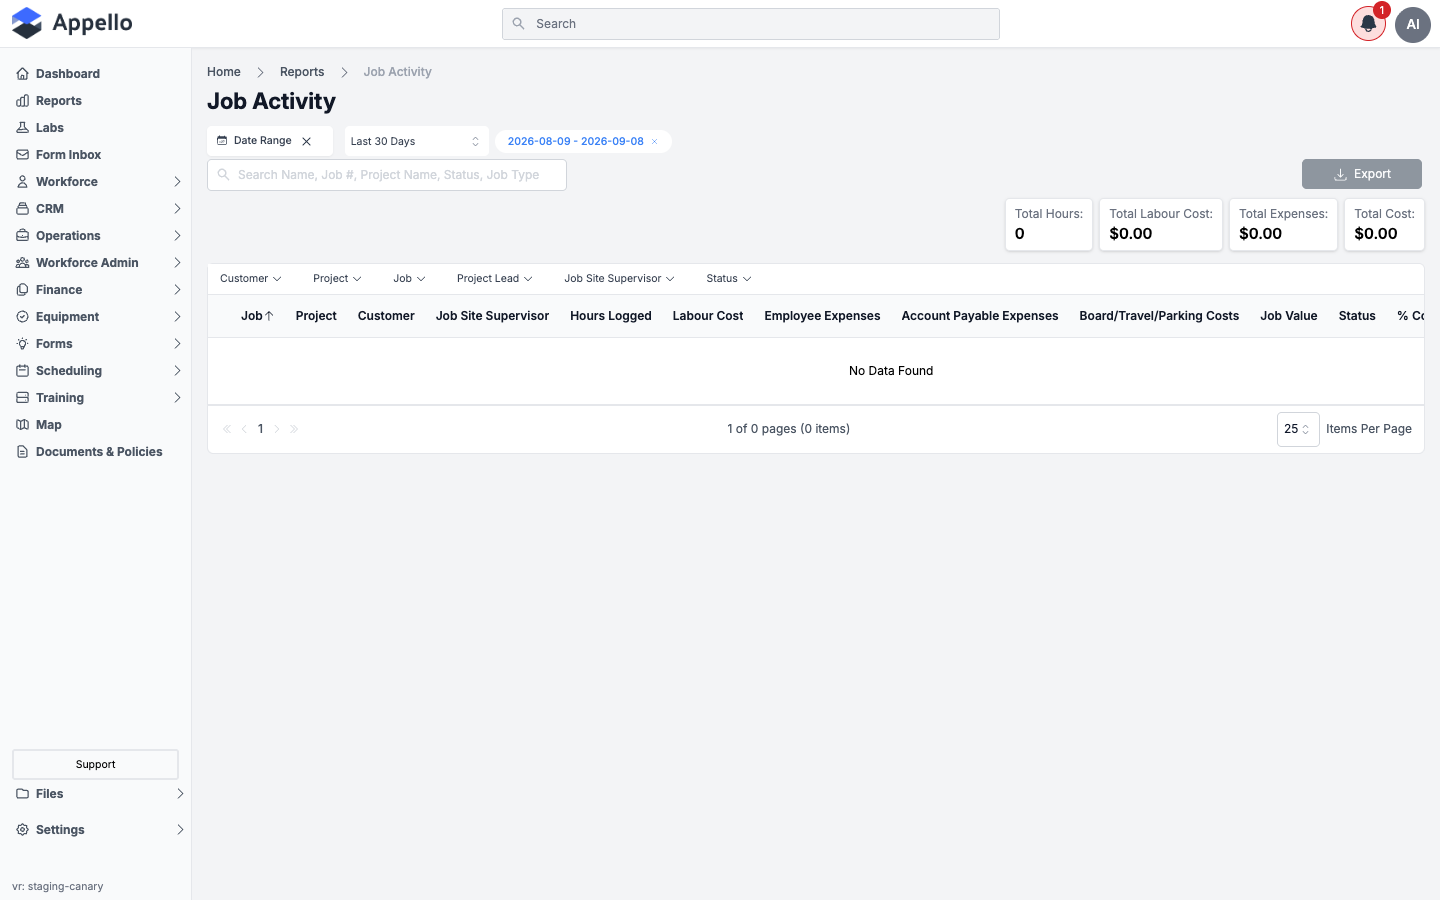
Shown empty on the demo instance — checked every calendar month from January through September 2026; none has any approved timesheet hours, board/travel/parking costs, or approved expenses recorded against a job, so the table reads "No Data Found" and all four total badges read 0 / $0.00 regardless of range.
Screenshot — filter open
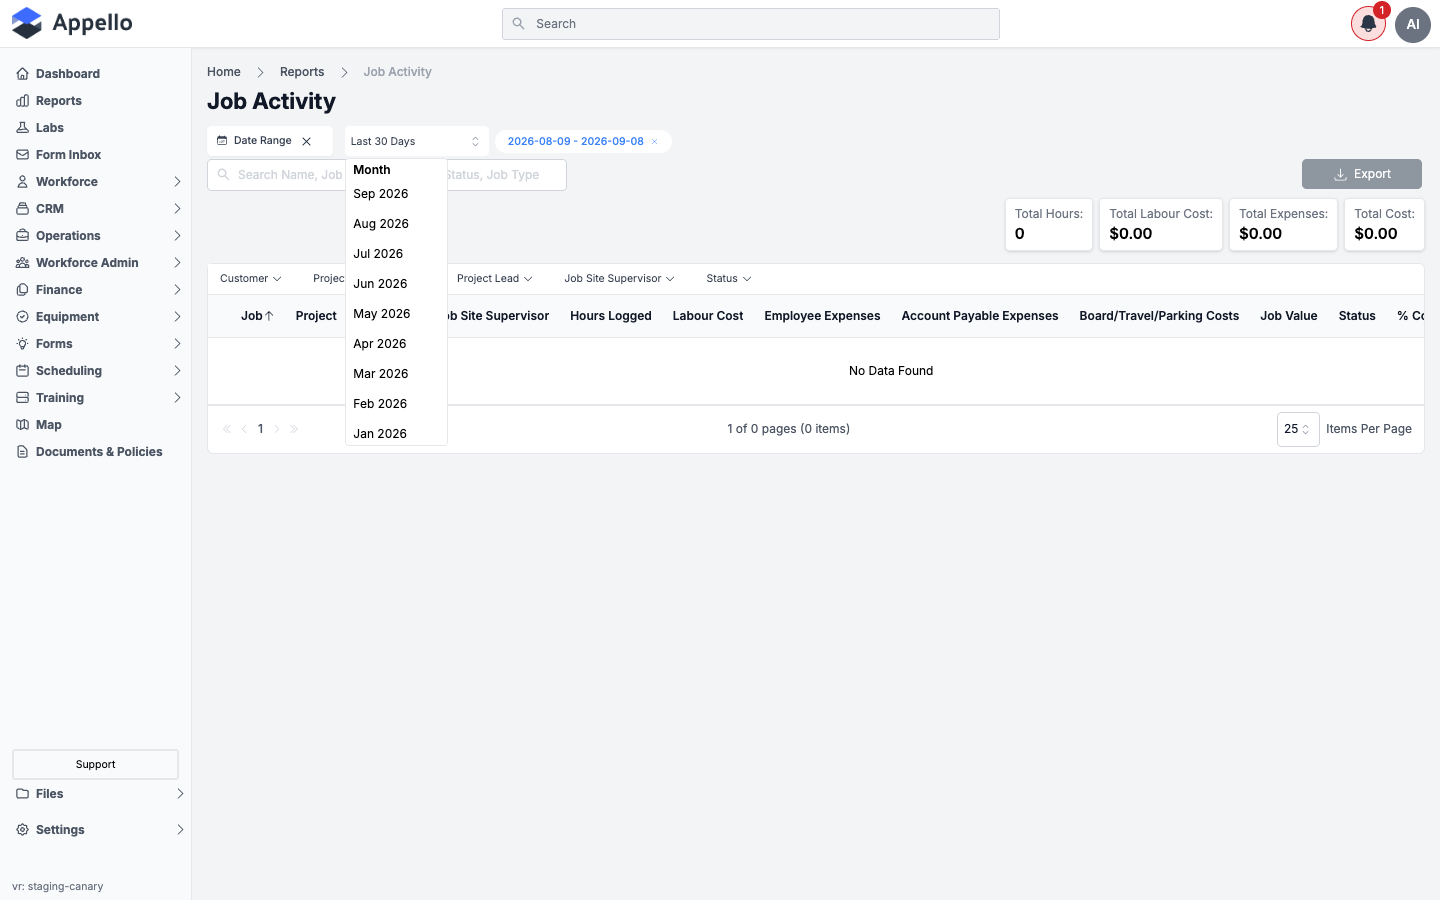
Date-range filter
| Control | Description |
|---|---|
| Date Range | Defaults to Last 30 Days. The dropdown offers quick values (Month, and each of the last several calendar months) plus a custom start/end date; the resolved range is shown next to it (e.g. 2026-08-09 - 2026-09-08). Calendar Year and a free-form Custom option are excluded from the quick-value list on this report. |
The date range is applied to when the activity happened (timesheet work date; expense date), not to the job's own dates — a long-running job with no activity in the window simply won't appear.
Other controls
| Control | Description |
|---|---|
| Search | Free-text search across job name, job #, project name, status, and job type. |
| Customer / Project / Job / Project Lead / Job Site Supervisor / Status | Column-header filter dropdowns, each populated from the jobs that actually have activity in the current date range. |
| Export | Downloads the filtered rows as CSV. |
What counts as "activity"
A job appears in the results only if, within the selected date range, at least one of the following is greater than zero:
- Approved timesheet hours (
Hours Logged) - Approved timesheet wages (
Labour Cost) - Timesheet-based Board, Travel, or Parking charges
- Approved Employee Expenses
- Approved Accounts Payable expenses
Jobs with no qualifying activity in the window are excluded entirely, even if the job itself is still open.
Columns
| Column | Calculation |
|---|---|
| Job | Job # and name, linking to the job's Overview tab. |
| Project | Project # and name, linking to the project's Overview tab (- if the job has no project). |
| Customer | Company name, linking to the company record when one is linked. |
| Job Site Supervisor | The job's assigned site supervisor. |
| Hours Logged | Sum of approved timesheet duration in the date range, in hours. Links to the Timesheet Report (filtered to this job) when greater than 0. |
| Labour Cost | Sum of approved timesheet wages in the date range. Links to the Timesheet Report when greater than 0. |
| Employee Expenses | Sum of approved Employee Expense line items in the date range. Links to Employee Expenses (filtered to this job) when greater than 0. |
| Account Payable Expenses | Sum of approved Accounts Payable expense line items in the date range. Links to Expenses (filtered to this job) when greater than 0. |
| Board/Travel/Parking Costs | Sum of the job's timesheet-based Board + Travel + Parking charges in the date range. Links to the Timesheet Report when greater than 0. |
| Job Value | The job's current value (not windowed by the date range). |
| Status | The job's current status, as a colored badge. |
| % Complete | The job's progress-report percentage if one exists, otherwise its schedule-based progress. Shown as a colored bar (red under 25%, amber under 50%, blue under 75%, green at 75%+). |
| Total Cost | Labour Cost + Employee Expenses + Account Payable Expenses + Board/Travel/Parking Costs. |
Header totals
Four badges above the table total the entire filtered result set (not just the current page): Total Hours, Total Labour Cost, Total Expenses (Employee + AP + Board/Travel/Parking), and Total Cost (Total Expenses + Total Labour Cost).
How to run it
- Sidebar → Reports, then click Job Activity under Operations.
- Set the Date Range — pick a quick value or a custom range.
- Optionally narrow with Search or the column filters (Customer, Project, Job, Project Lead, Job Site Supervisor, Status).
- Review the table and the four total badges.
- Click a job's Hours Logged, Labour Cost, Employee Expenses, Account Payable Expenses, or Board/Travel/Parking Costs figure to jump to the underlying record set for that job.
- Click Export to download the filtered rows as CSV.
Permissions
- Operations → Jobs → View
- The Reports → Operations permission for Job Activity