Job Cost Report
Every job in Appello has a real-time costing hub built into its detail page. It rolls up what the job is worth, what has actually been spent, and where that spend is coming from -- timesheets, equipment time, accounts payable bills, employee expenses, and material issues -- without waiting for a month-end close.
This documentation covers the Financial Overview tab and the Financial Summary, Monthly Cost Report, Cost to Complete, and Equipment Breakdown views inside a job's Financials & Reporting tab group. Earned vs Burned is its own view and is covered in Cost Codes & Schedule of Values.
Navigation
Sidebar → Operations → Jobs → open a job → Financial Overview or Financials & Reporting
Before you start
- A job needs a Schedule of Values (SOV) with cost codes before the detailed dashboards (Financial Health, Progress & Performance, Cost Summary) will calculate. Without one, the page shows a banner pointing you to set one up. See Cost Codes & Schedule of Values.
- You need a role with Financial Summary view permission. That permission can be scoped to "project-based," which limits it to jobs where you are the job lead or project lead.
Financial Overview tab
The Financial Overview tab is a job-level dashboard -- a single screen answering "is this job healthy, and where does the money stand" before you drill into the detailed reports.
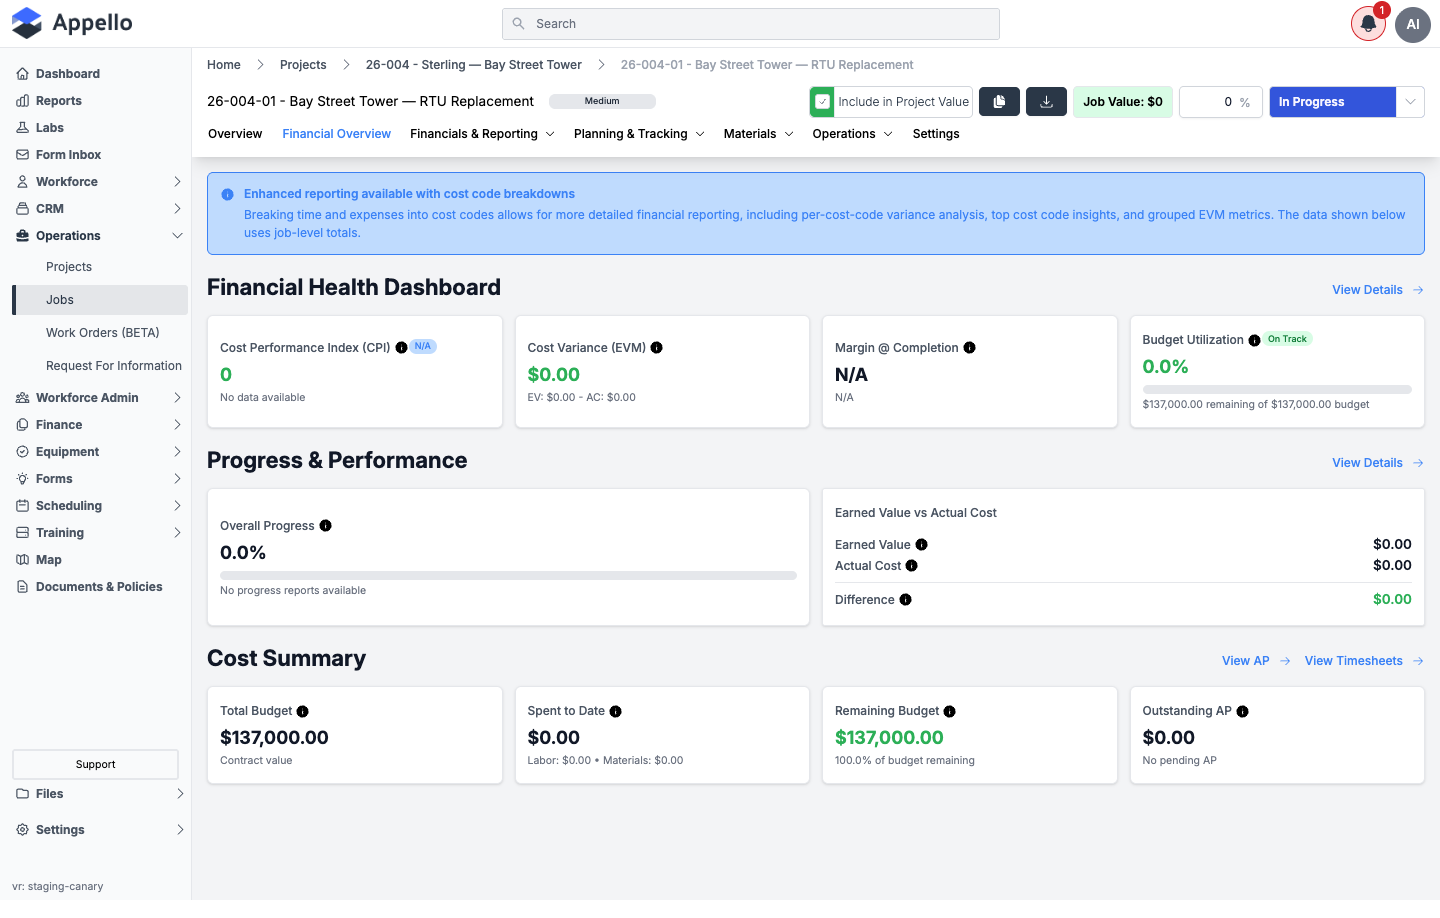
Financial Health Dashboard
| Metric | What it means |
|---|---|
| Cost Performance Index (CPI) | Earned Value ÷ Actual Cost. 1.0 or higher means you're earning more value than you're spending. ≥ 1.0 = On Budget, 0.9 -- 1.0 = At Risk, < 0.9 = Over Budget. |
| Cost Variance (EVM) | Earned Value minus Actual Cost. Positive = under budget, negative = over budget. |
| Margin @ Completion | Projected profit at project completion -- Contract Value minus Estimated Final Cost -- shown as both a dollar amount and a percentage. |
| Budget Utilization | (Actual Cost ÷ Total Budget) × 100. < 75% = On Track, 75 -- 90% = At Risk, > 90% = High Usage. |
Progress & Performance
- Overall Progress -- the percentage of work completed, sourced from the most recent approved progress report, weighted by cost code budget allocations.
- Earned Value vs Actual Cost -- Earned Value (% Complete × original budget), Actual Cost (labor from timesheets plus materials from accounts payable), and the Difference between them.
- A Latest Progress Report card shows the most recent report's number and date, when one exists.
Cost Summary
| Metric | What it means |
|---|---|
| Total Budget | Contract value, sourced from the Schedule of Values. |
| Spent to Date | Total cost incurred to date -- labor (timesheets) plus materials (accounts payable). |
| Remaining Budget | Total Budget minus Spent to Date. |
| Outstanding AP | Total dollar value of accounts payable bills entered but not yet paid. |
View AP and View Timesheets links next to Cost Summary jump straight to the job's Accounts Payable list and the company Timesheet Log, filtered to this job.
The example job used for the screenshots above has no Schedule of Values costed activity yet in this demo instance, so its dollar figures read as $0.00 -- the layout, labels, and drill-through links are otherwise exactly what a live job shows.
Drilling into cost categories (Financial Summary)
Financials & Reporting → Financial Summary is the line-item version of the same numbers -- every account item that has posted cost against the job, grouped into categories, with Estimate, Change Order, Actual, and Difference columns side by side.
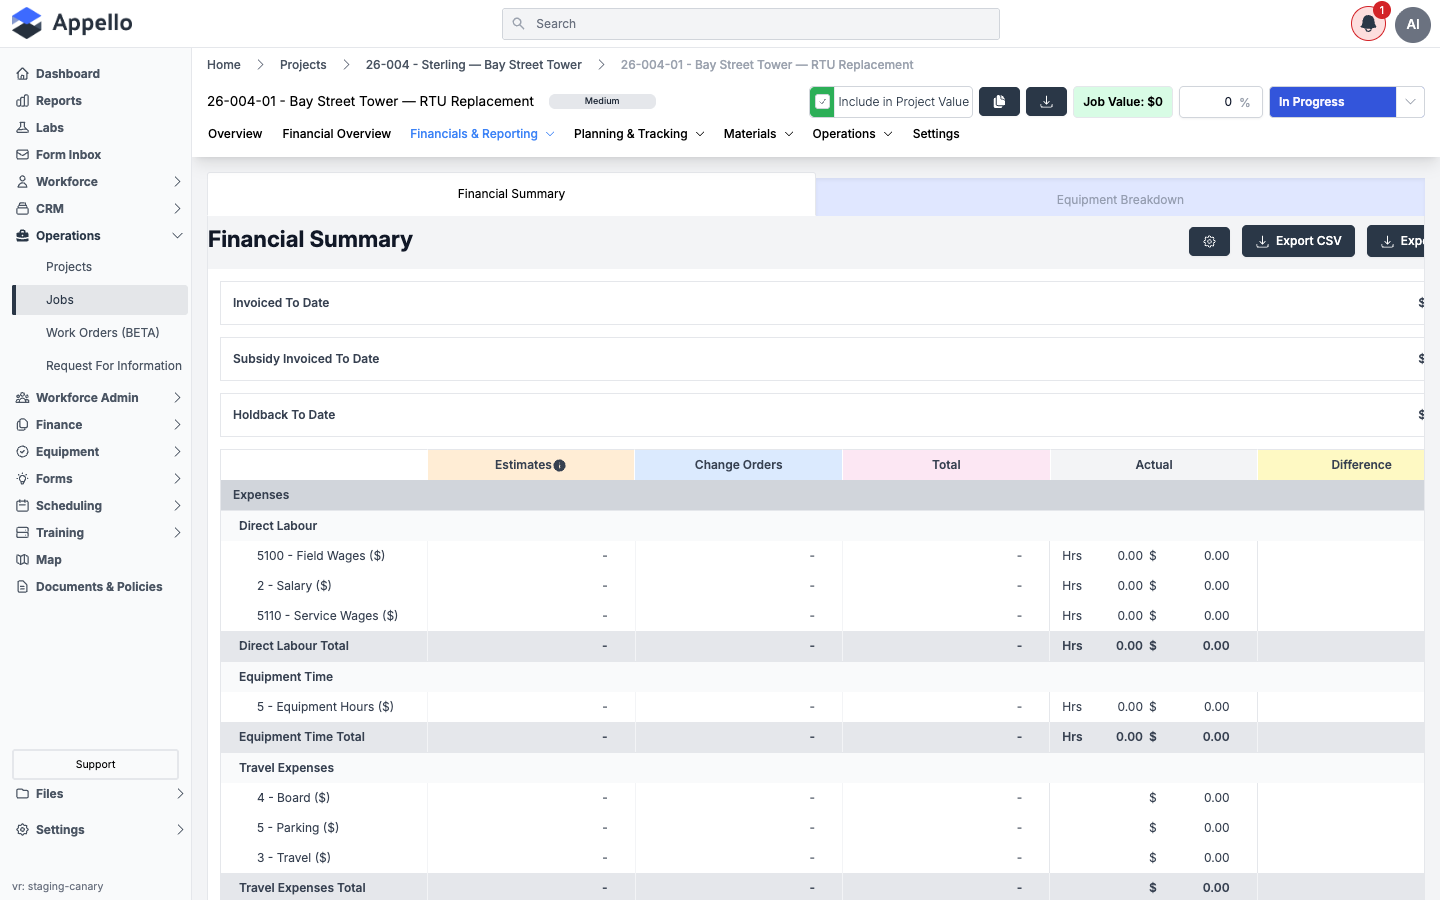
Rows are grouped into categories such as:
- Direct Labour -- account items like Field Wages, Salary, and Service Wages, with an Hrs figure alongside the dollar actual for each.
- Equipment Time -- equipment-hours account items.
- Travel Expenses -- Board, Parking, and Travel account items.
- Further categories for materials, subcontracts, and other expense accounts configured on your instance's chart of accounts.
Each category rolls up to a Total row, and the whole grid rolls up to a grand total at the bottom. Use Export CSV or Export PDF (top right) to hand the same breakdown to someone outside Appello.
Equipment Breakdown
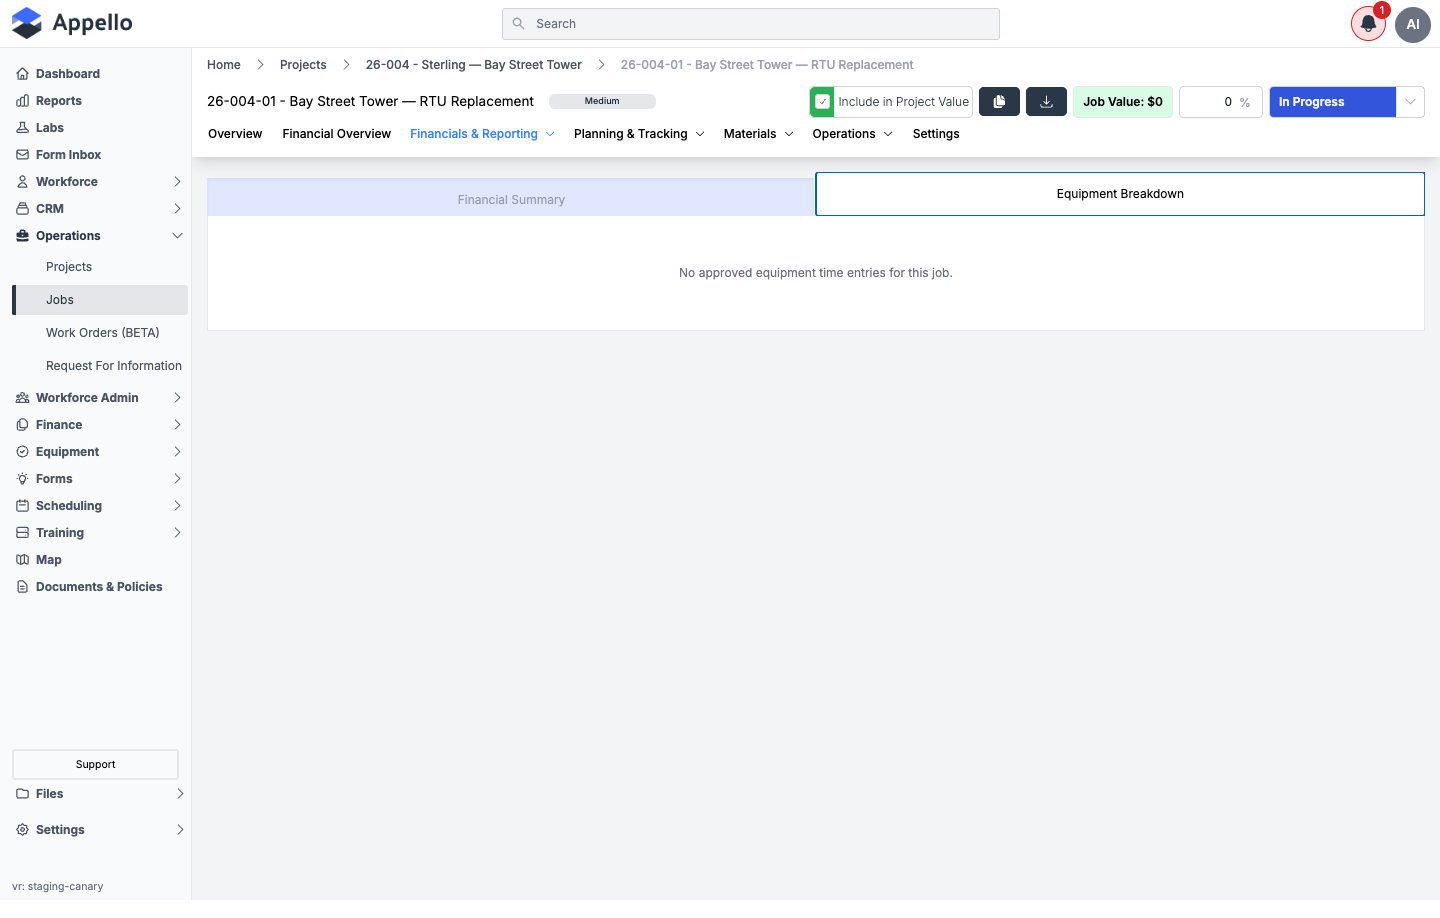
The second sub-tab, Equipment Breakdown, lists approved equipment time entries charged to the job. If no equipment time has been approved against the job yet, it reads "No approved equipment time entries for this job."
How actuals stay current
Appello does not wait for a batch job or a nightly sync -- the Actual column on Financial Summary (and everywhere it feeds into) is computed from live, approved records each time the page loads:
| Category | Actual is built from |
|---|---|
| Direct Labour | Approved timesheet wages, plus Work Order labor line cost, plus Board and Travel account items. |
| Equipment Time | Approved equipment time entries' cost, plus Work Order equipment line cost. |
| Materials / other | Approved accounts payable bills, approved employee expenses, material issues, and Work Order material line cost. |
Only approved timesheets, accounts payable bills, and employee expenses count toward Actual. A submitted-but-not-yet-approved timesheet or bill does not move the numbers on this page until it clears approval -- on instances with the as-of date view enabled, a notice banner on Financial Summary calls out exactly how many pending timesheet entries, AP bills, and employee expenses are being held back from the total, and their combined dollar value.
Because every surface -- this grid, the Financial Overview dashboard, the exported PDF, and the CSV export -- computes Actual with the same rule, the numbers always tie out to each other.
Labor cost analysis and cost-code hours
Once timesheet hours have been logged against a job, the Financial Overview tab adds a Workforce Metrics section below Cost Summary:
- Total Labor Hours -- sum of all timesheet hours logged against the job, across every cost code and worker.
- Average Weekly Hours -- total labor hours divided by the number of weeks with recorded activity.
- Top Cost Code -- the cost code with the most hours logged, showing which scope of work is absorbing the most labor.
- Labor Efficiency -- (Actual Hours ÷ Planned Hours) × 100 over the most recent 4 weeks. 100% = on pace, above 100% = faster than planned, below 100% = slower than planned.
- A Labor Hours curve chart (planned vs. projected vs. actual, by week) and a Top Cost Codes chart.
- A Labor Summary by Cost Code table -- Cost Code, Description, Total Hours, Total Cost, and Average Cost per Hour for every cost code with logged time.
A View Details link on this section opens the full company Timesheet Log filtered to the job.
The demo job used for this page's screenshots has no timesheet hours logged, so the Workforce Metrics section does not render for it -- Appello only shows this section once a job has recorded labor hours. The metric definitions above are drawn from the application's source code, not a screenshot.
Cost tracking vs. budget
Three views track spend against budget as the job progresses:
- Financial Overview → Financial Health Dashboard -- the Budget Utilization metric and its On Track / At Risk / High Usage badge (see the table above).
- Financials & Reporting → Monthly Cost Report -- Total SOV Budget, Total to Date, Total Remaining, and % Used, broken out by cost code across a rolling month-by-month date range, plus a Monthly Cost Stacked Bar Chart and a Cumulative vs. SOV Budget line chart comparing running spend against the flat budget line.
- Financials & Reporting → Cost to Complete -- a forecast table with Average CPI, Average Margin, and Latest Forecast, showing forecast cost, forecast value, margin, and CPI for each progress-report period. Forecasts are auto-generated for progress reports that don't have one yet, and keep updating until a forecast is approved.
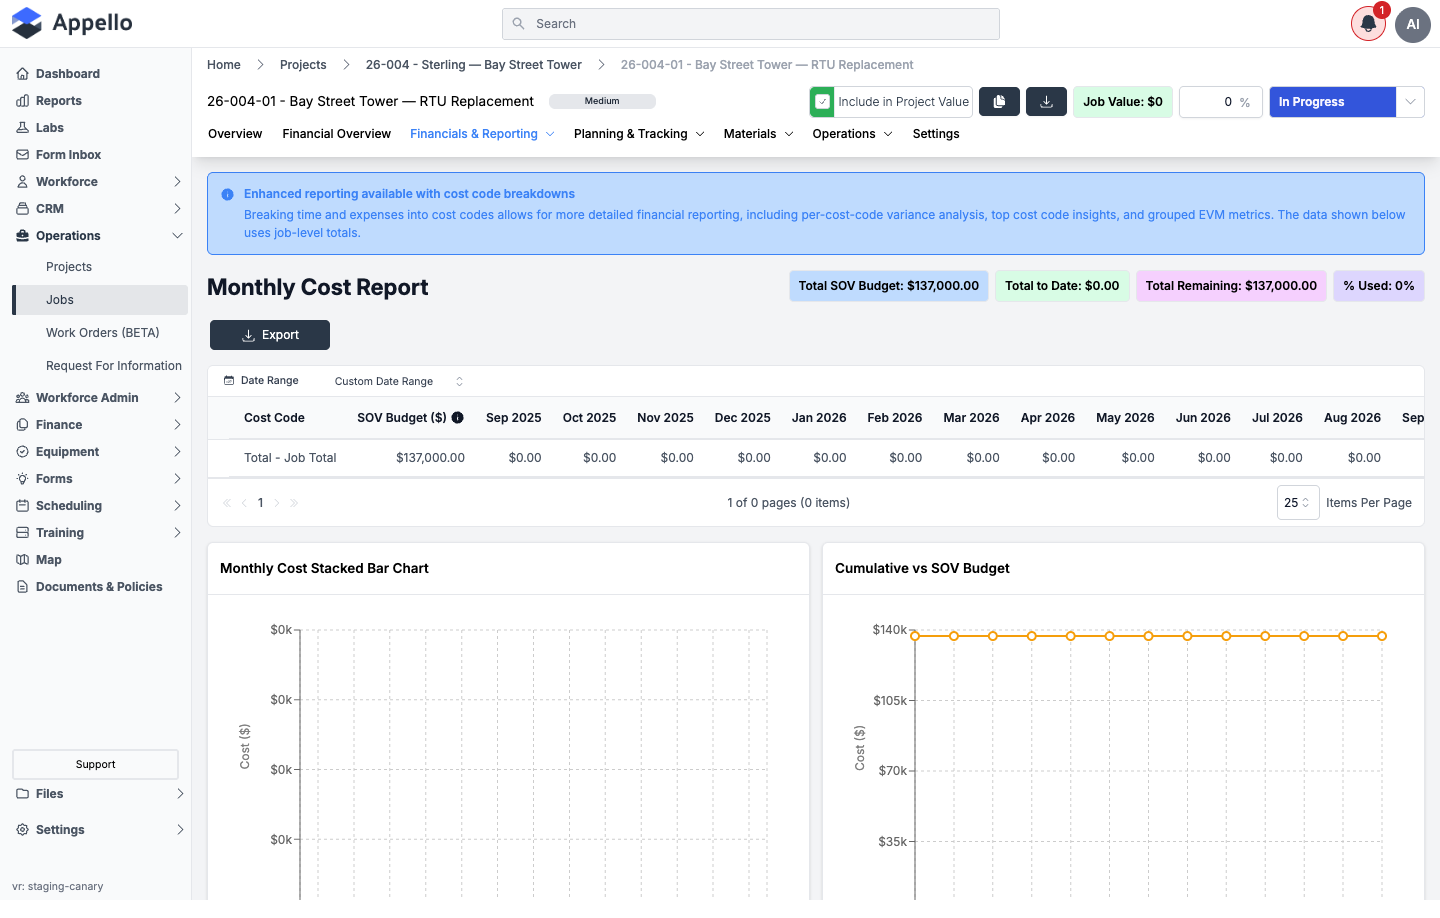
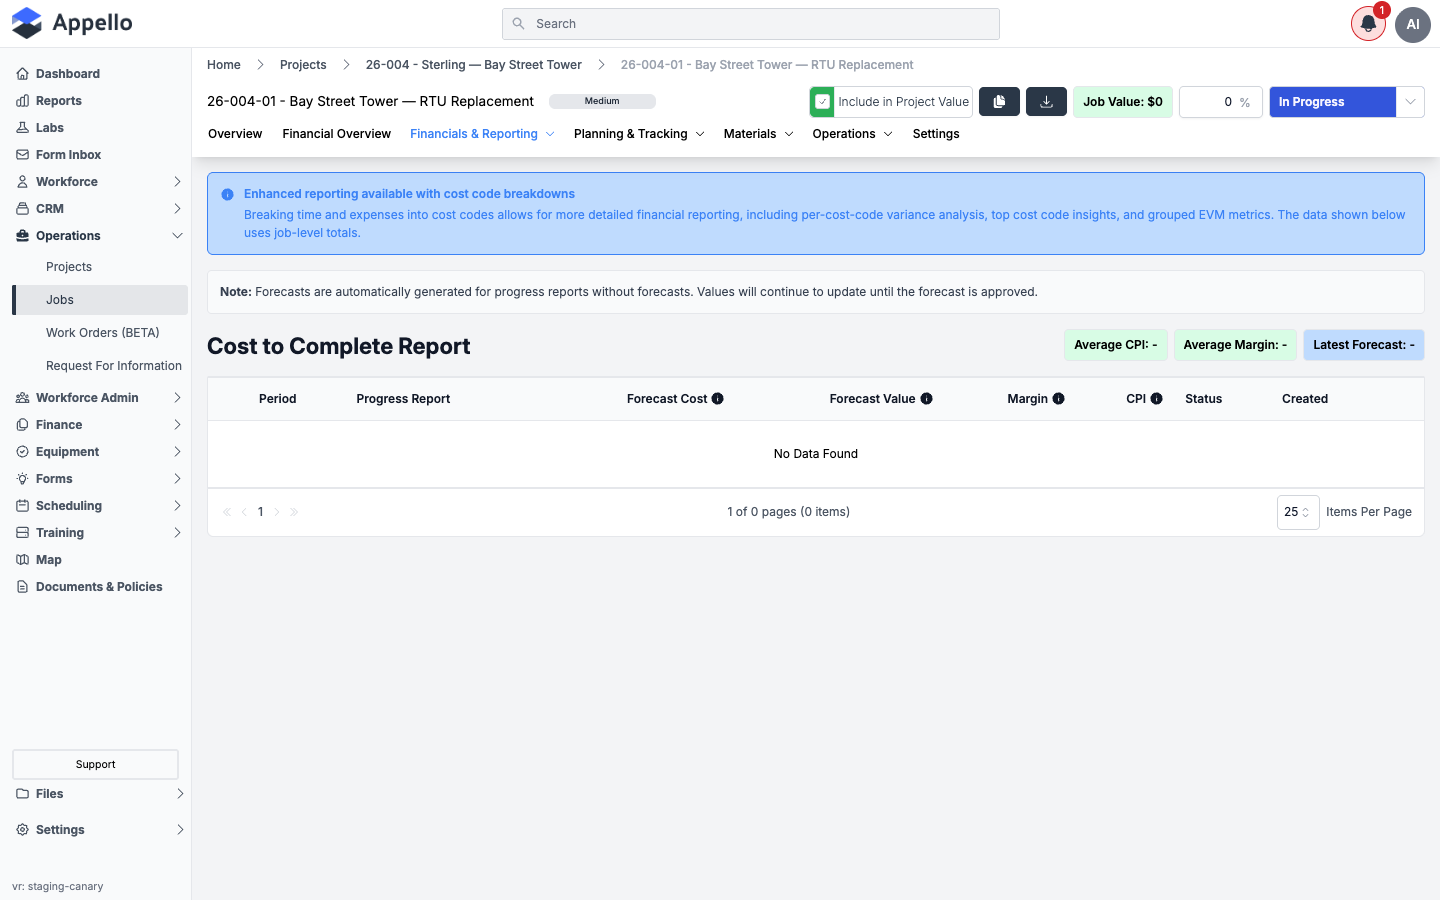
Both reports use a Date Range picker at the top -- shown here on its default range. Change it to widen or narrow the months included without affecting any underlying data.
Related pages
- Cost Codes & Schedule of Values -- how cost codes and the SOV are set up, and how Earned vs Burned compares earned value to actual cost per cost code.
- Progress Reports -- the approved progress reports that drive Overall Progress and Earned Value.
- Accounts Payable Expenses -- entering and approving the AP bills that flow into Actual Cost here.